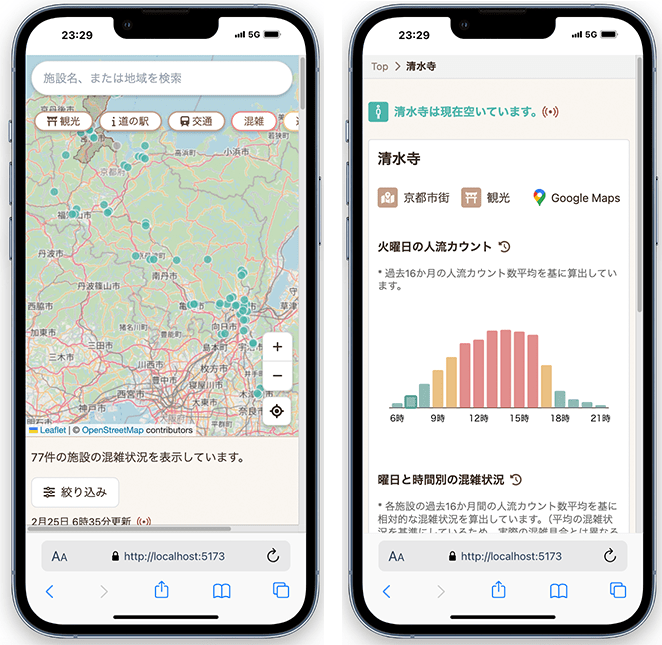
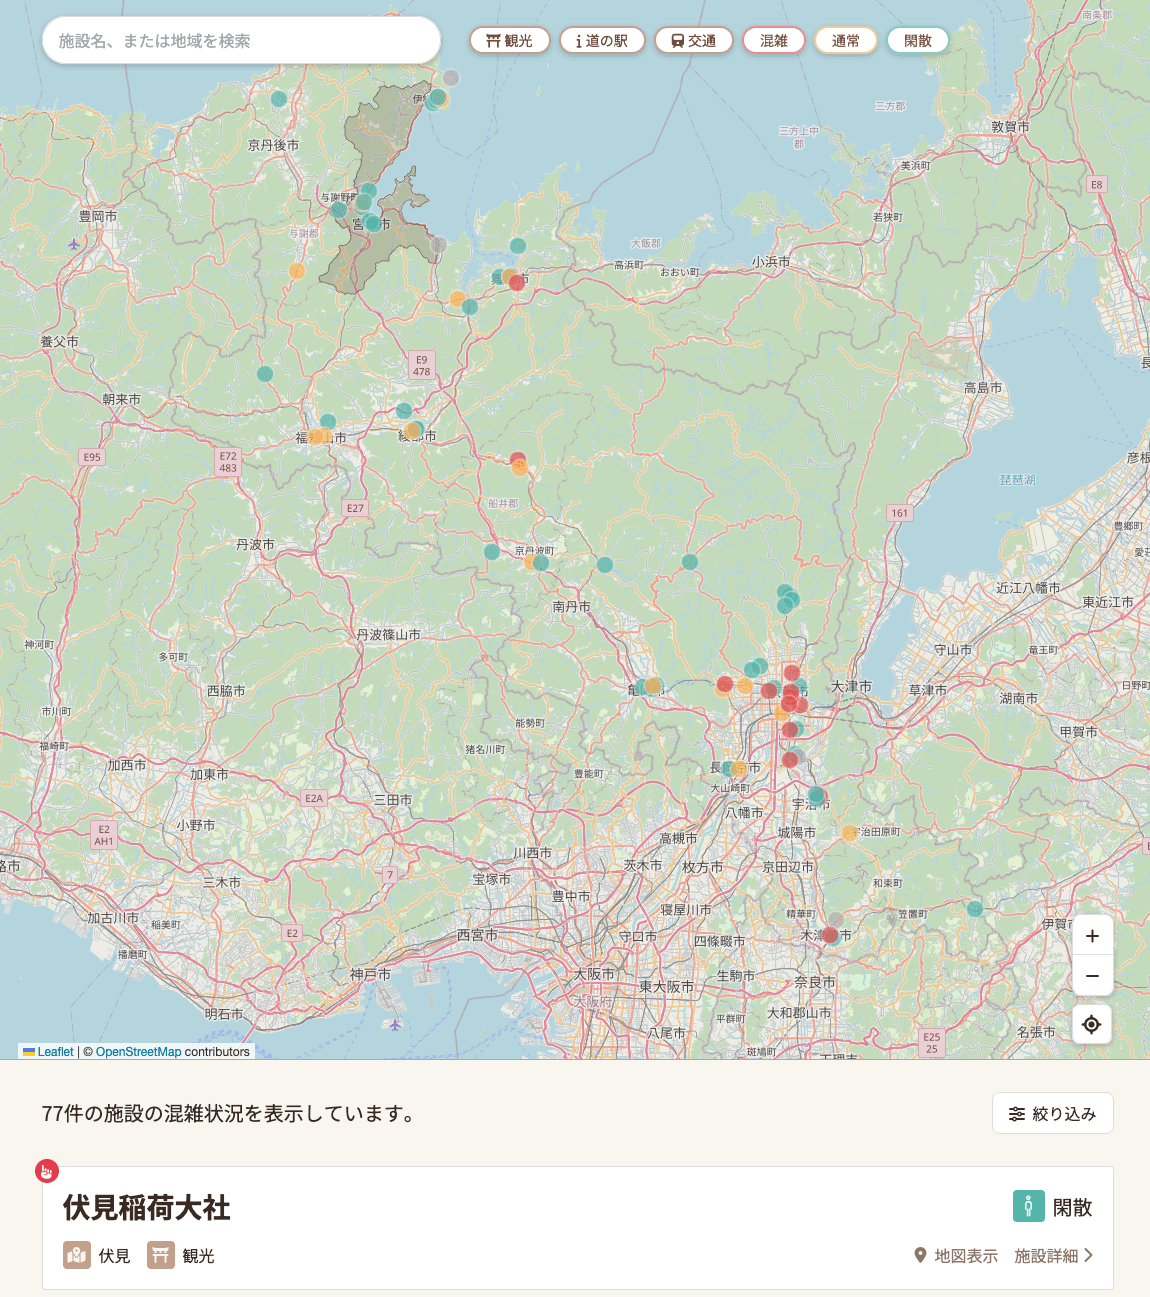
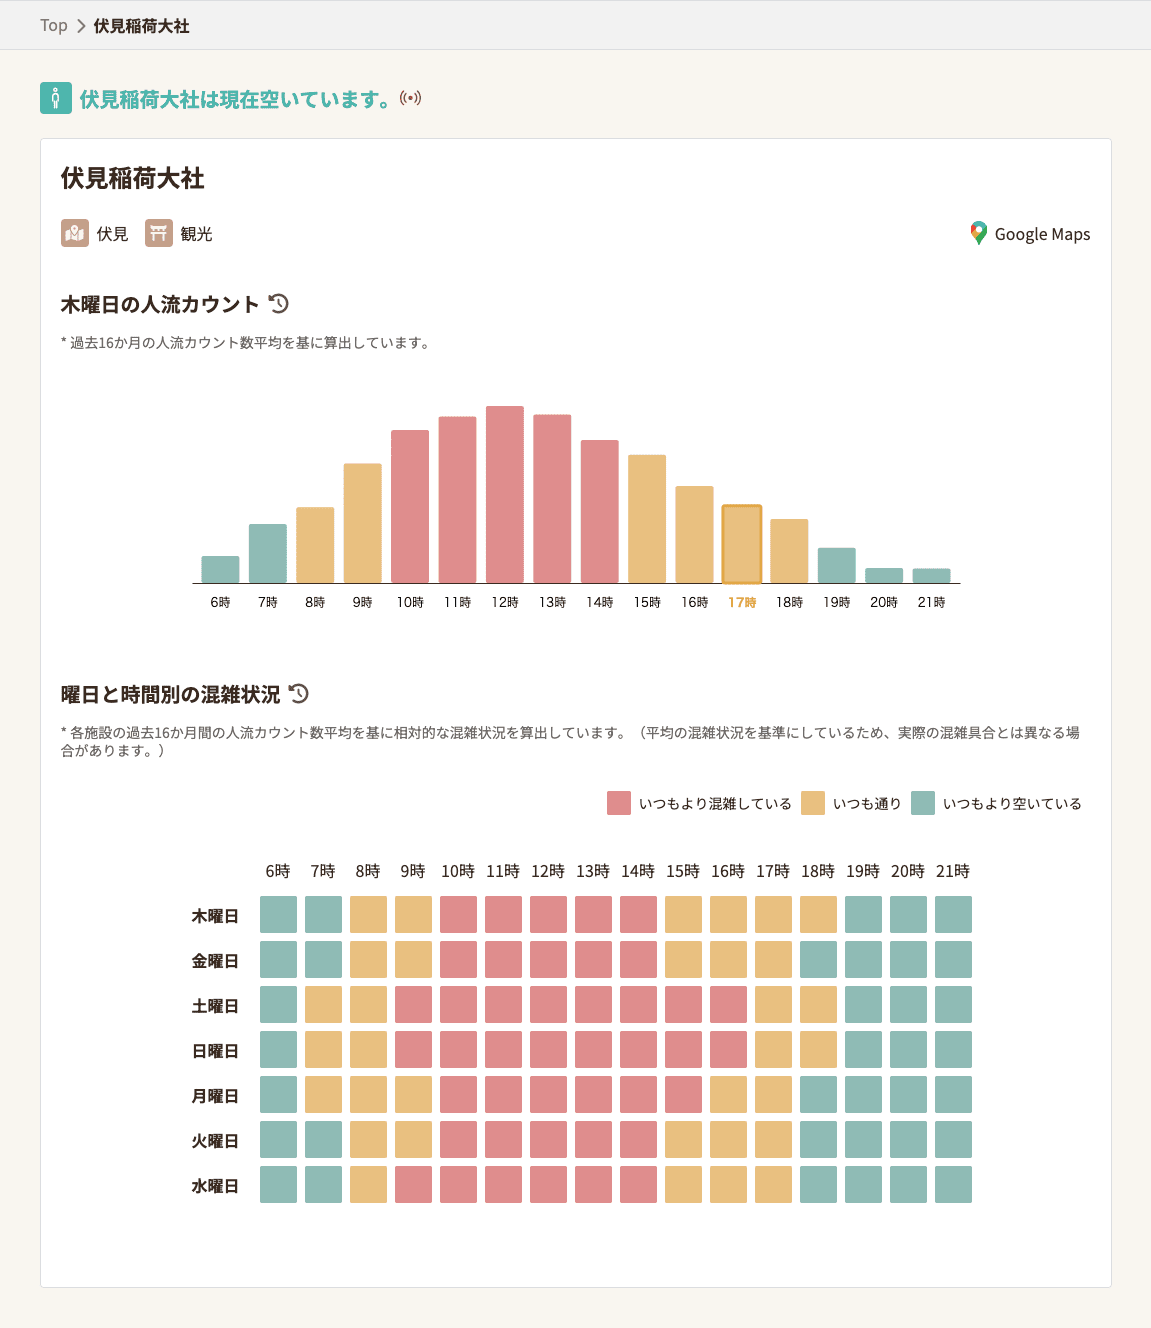
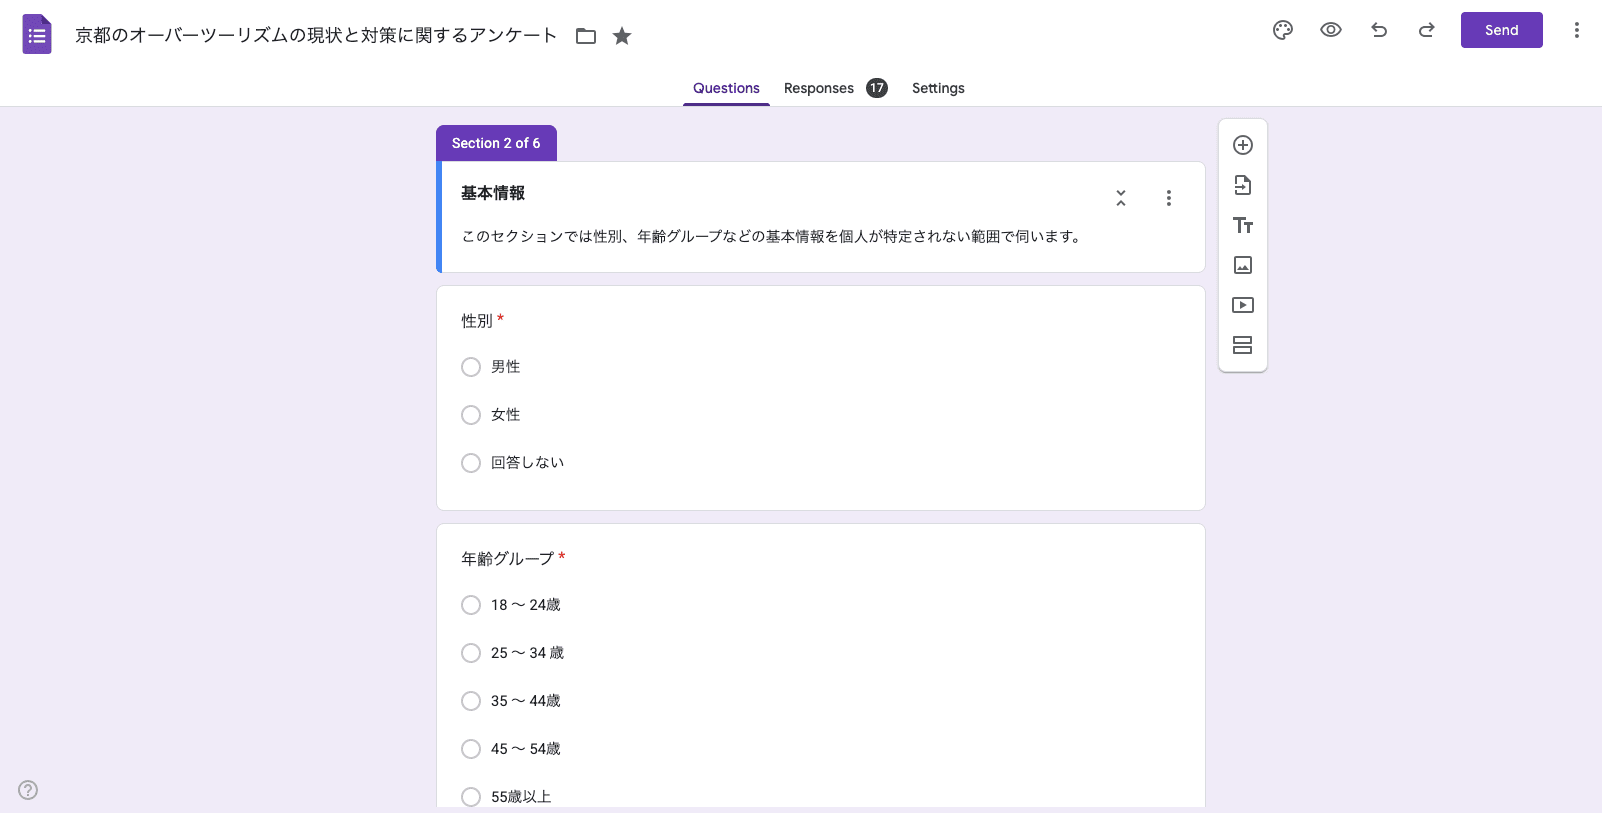
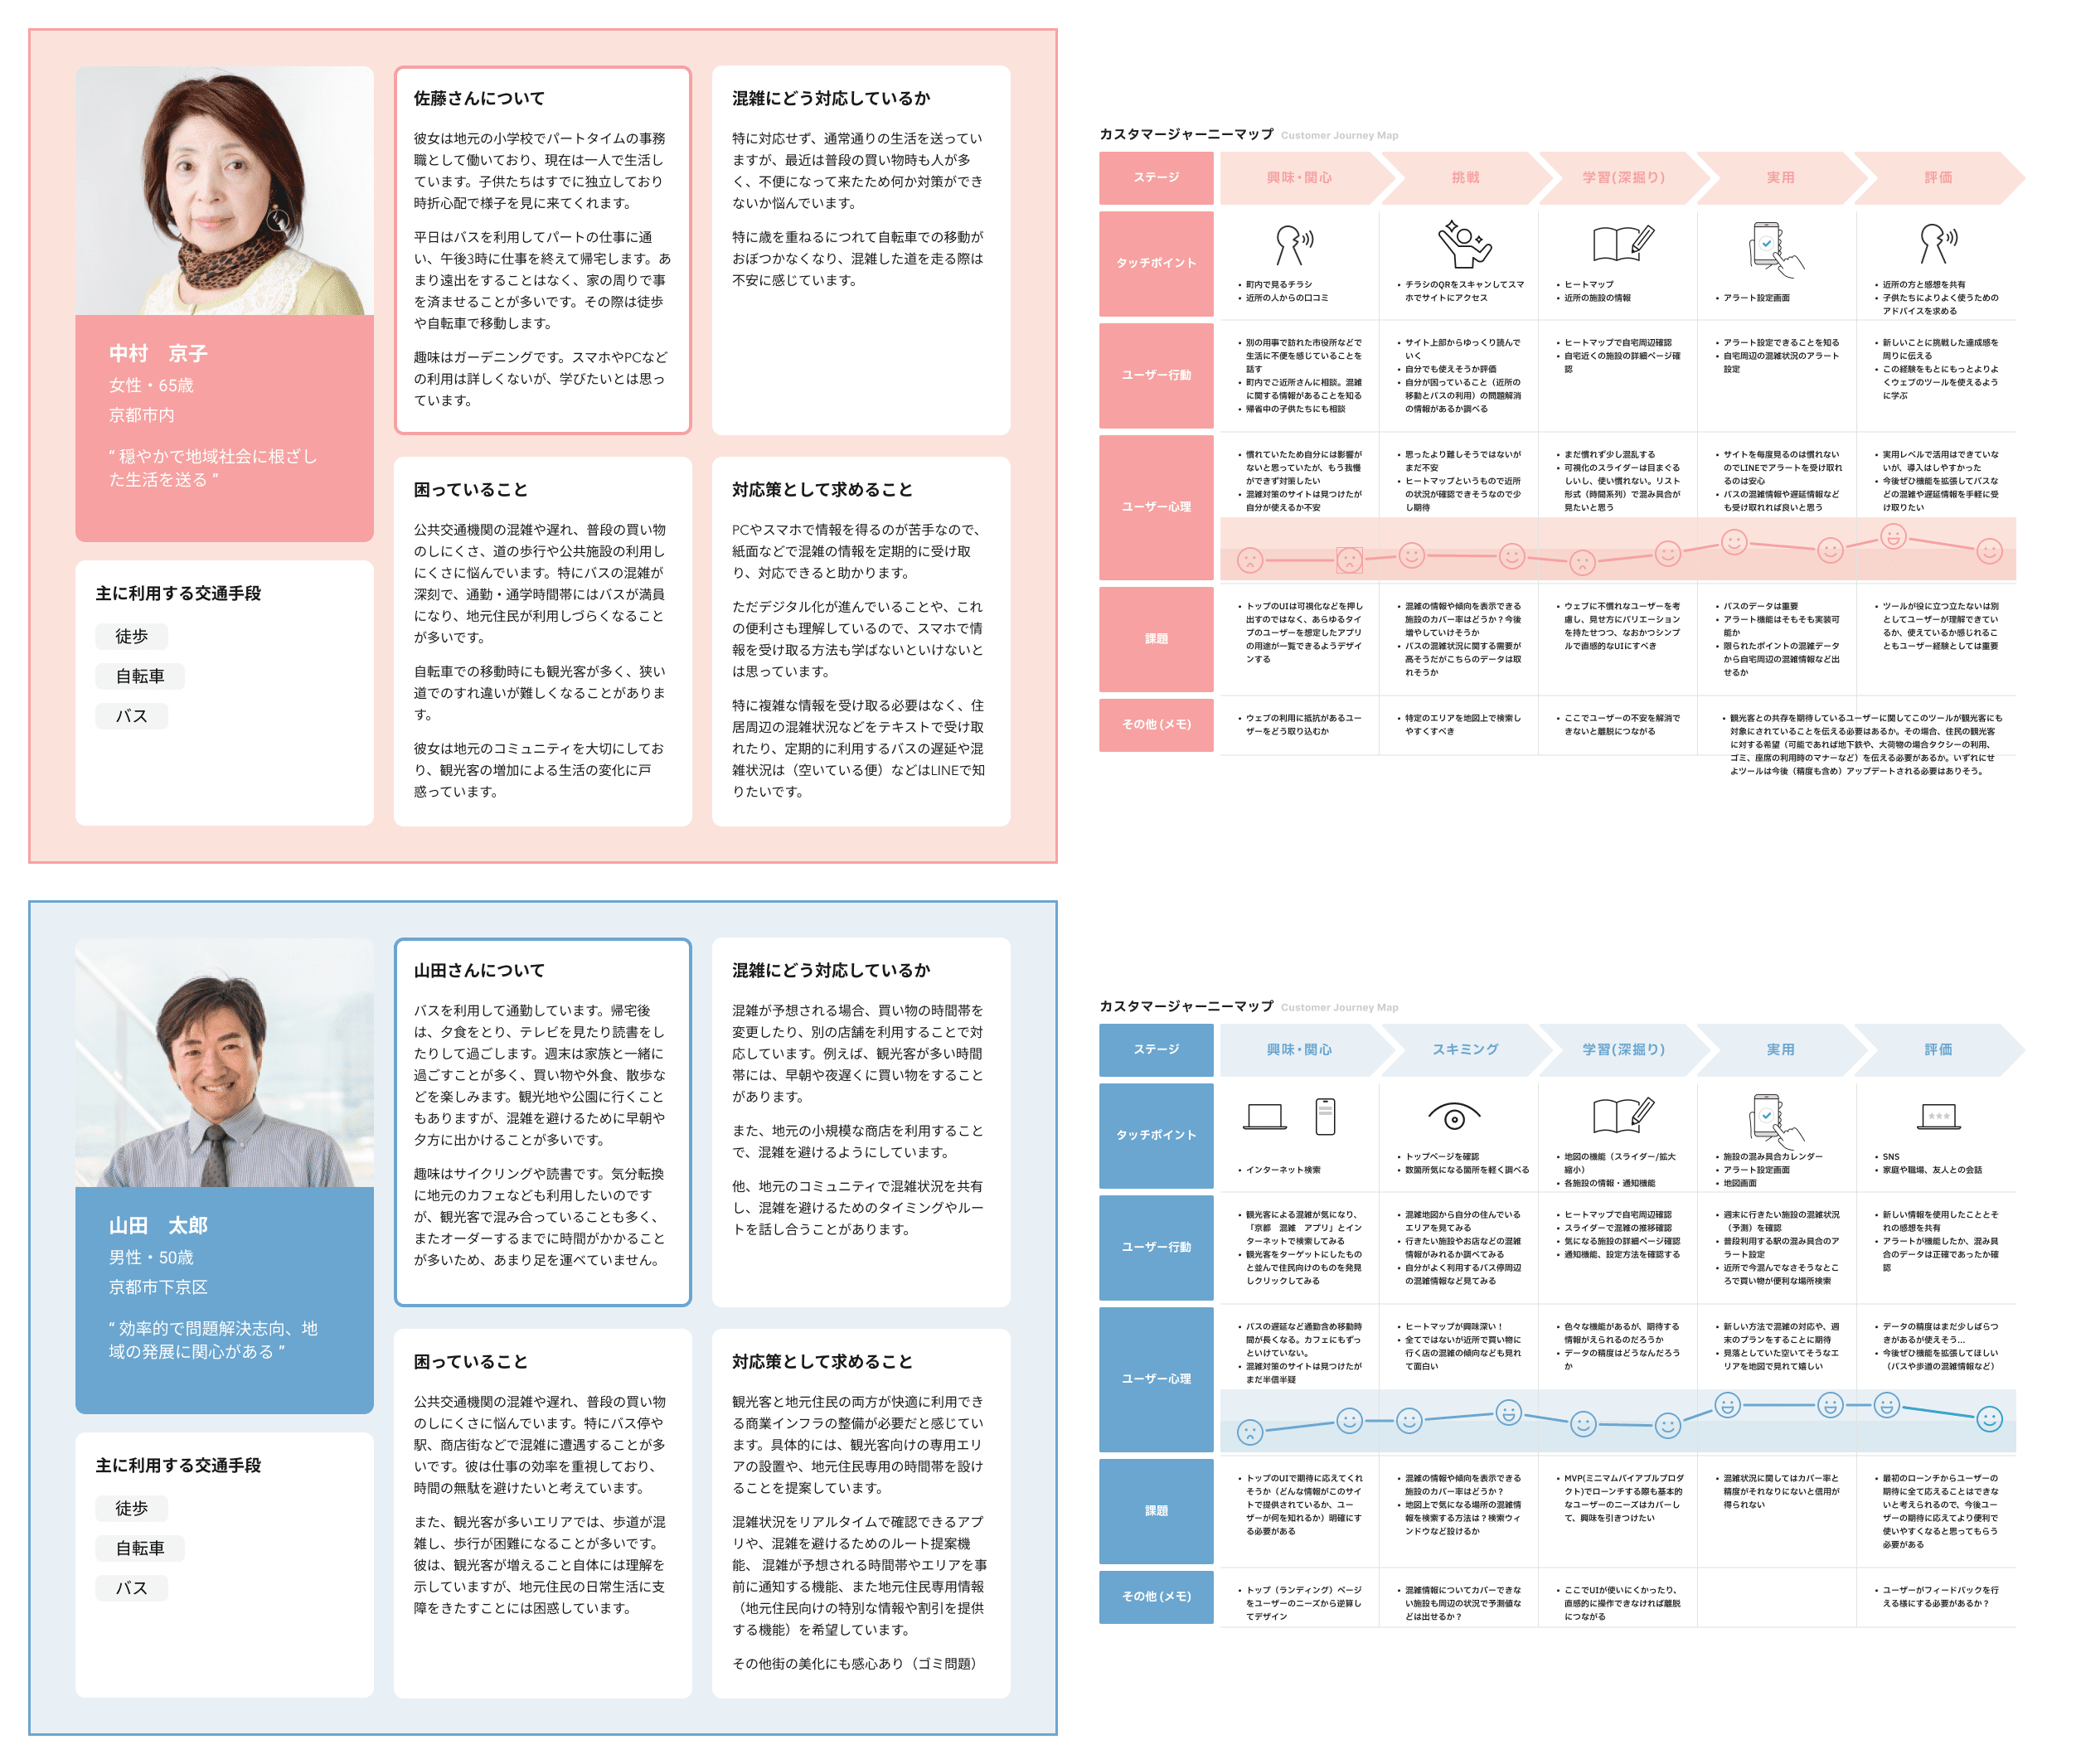
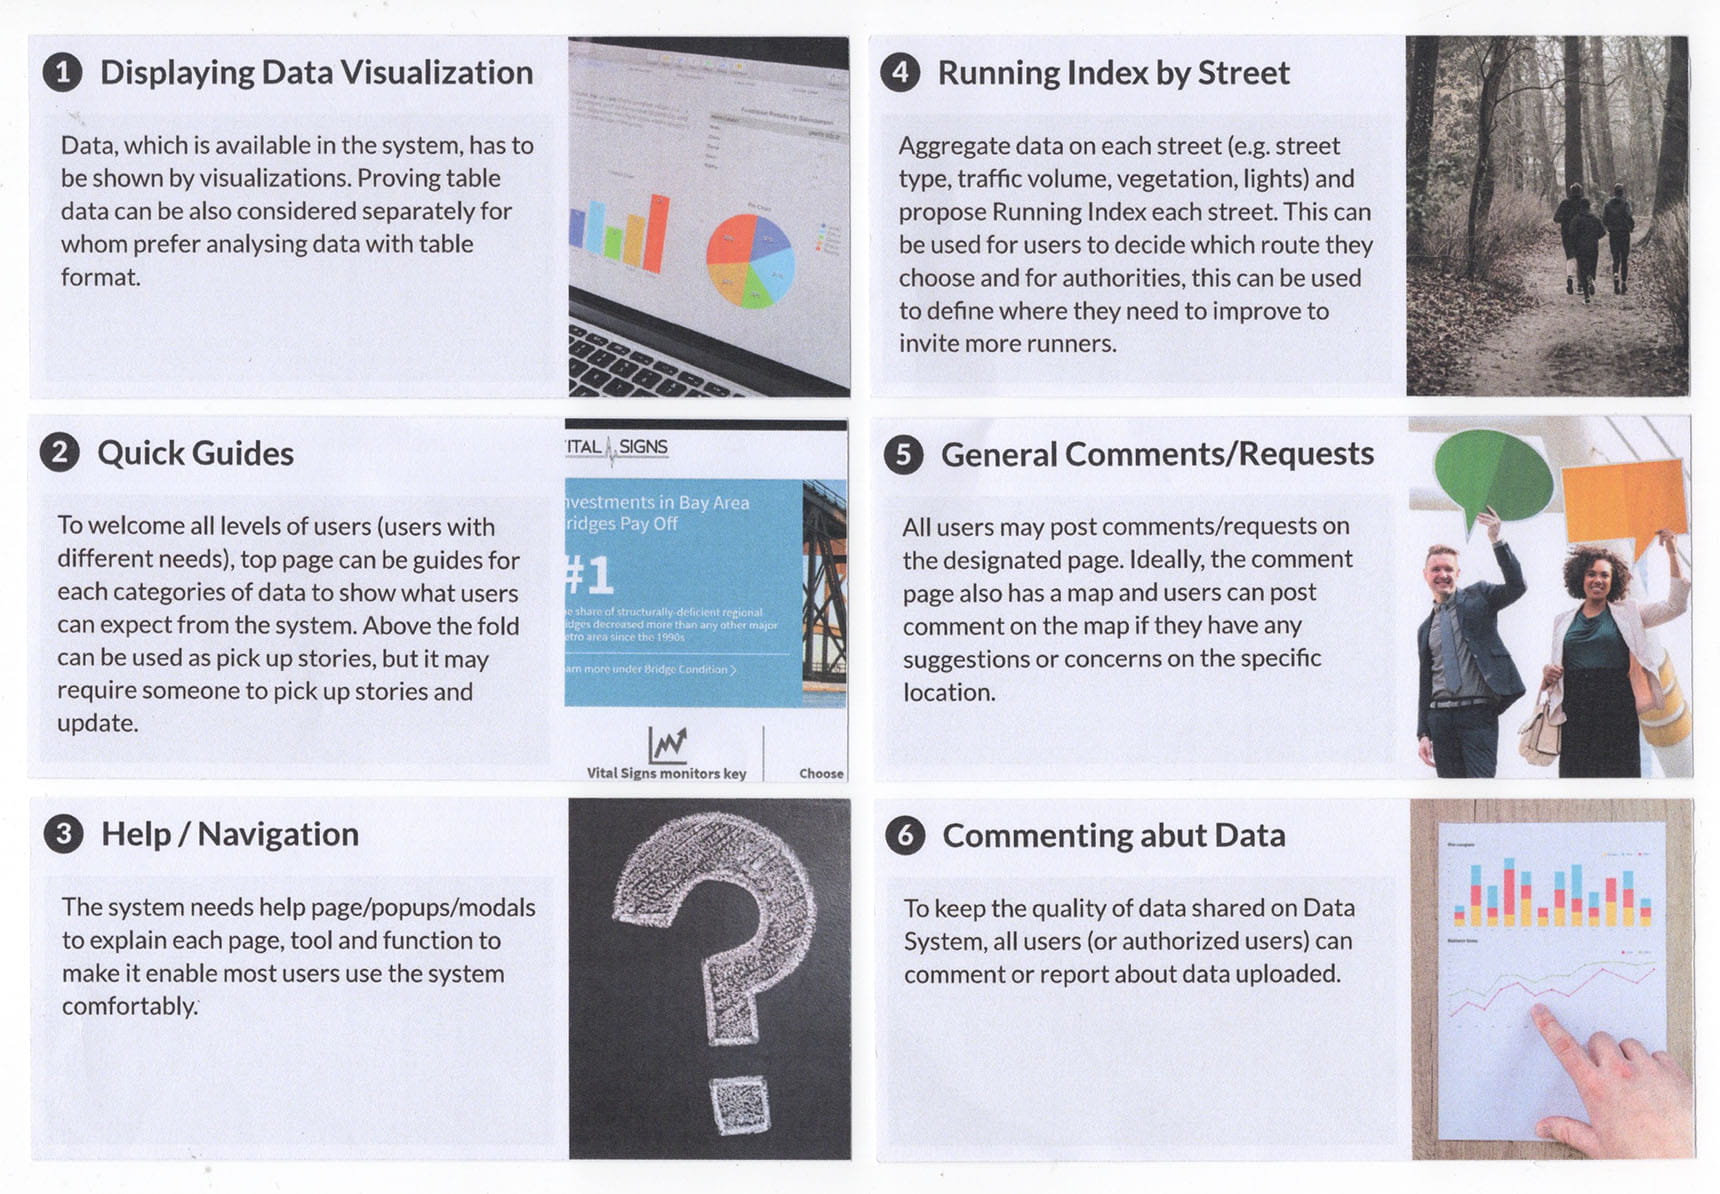
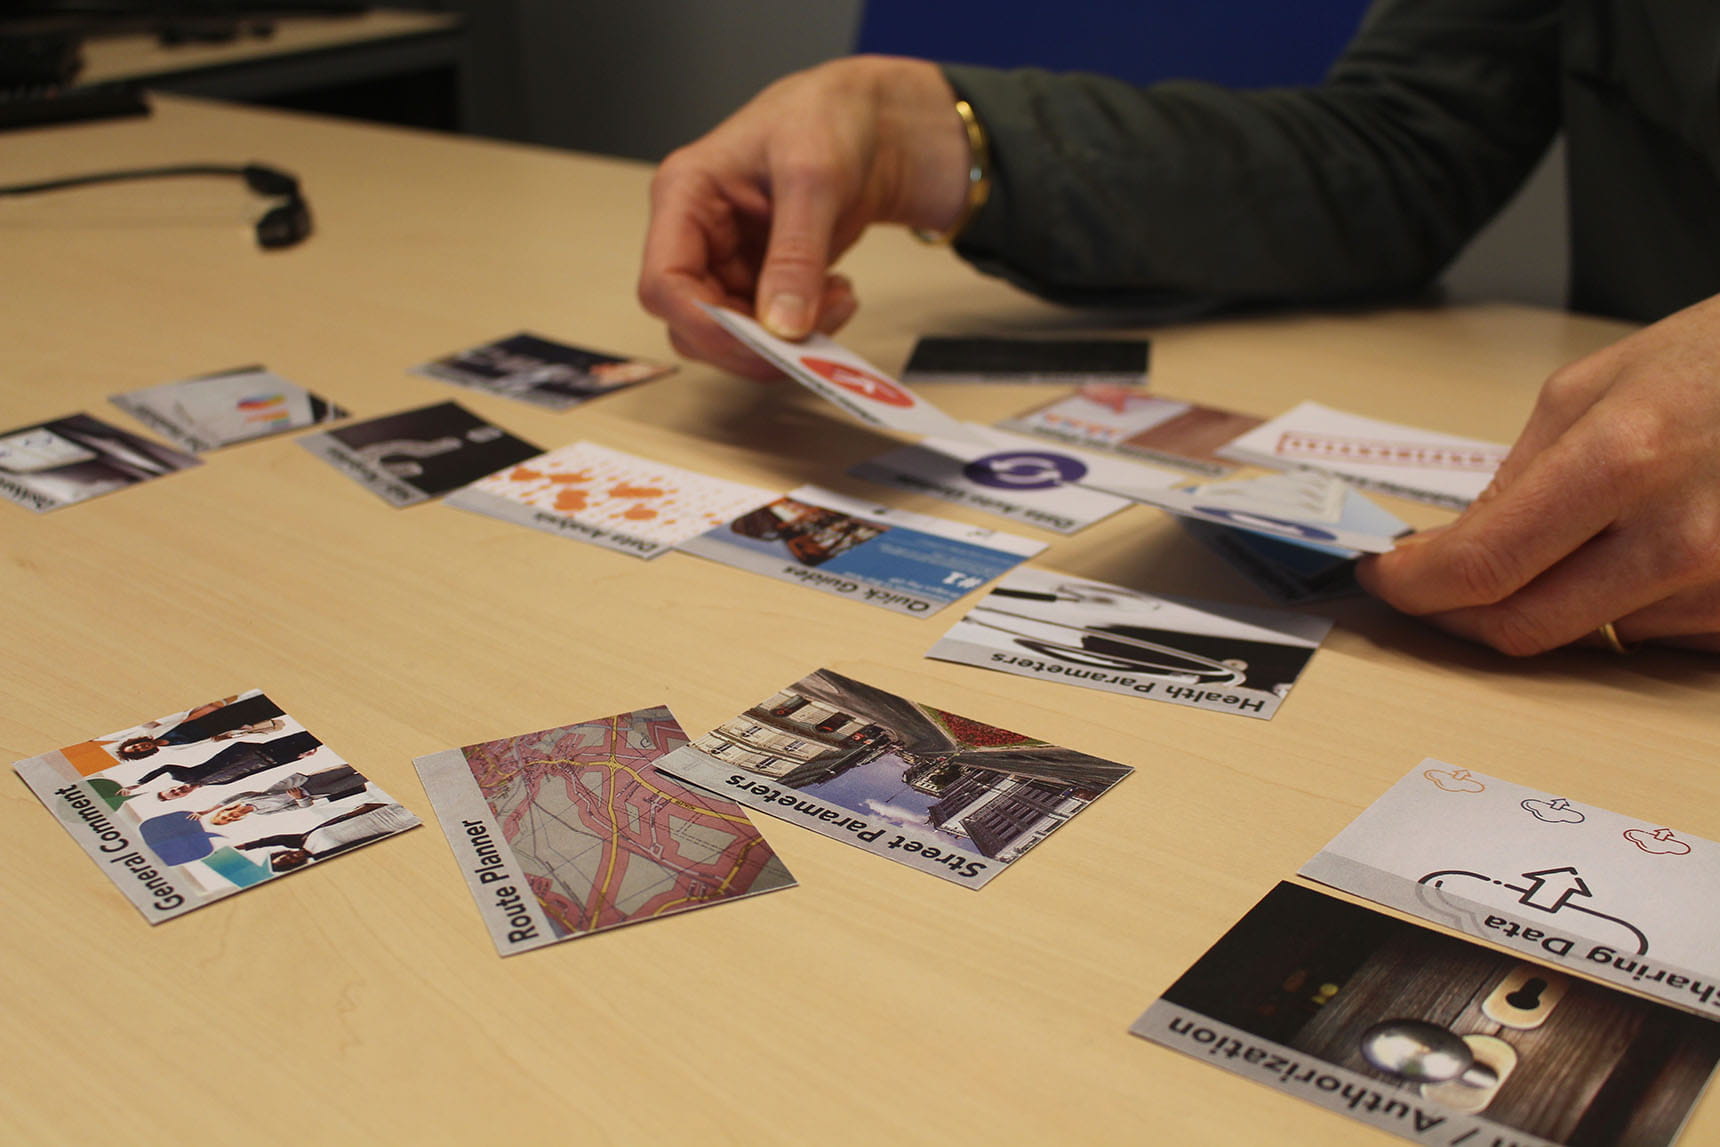
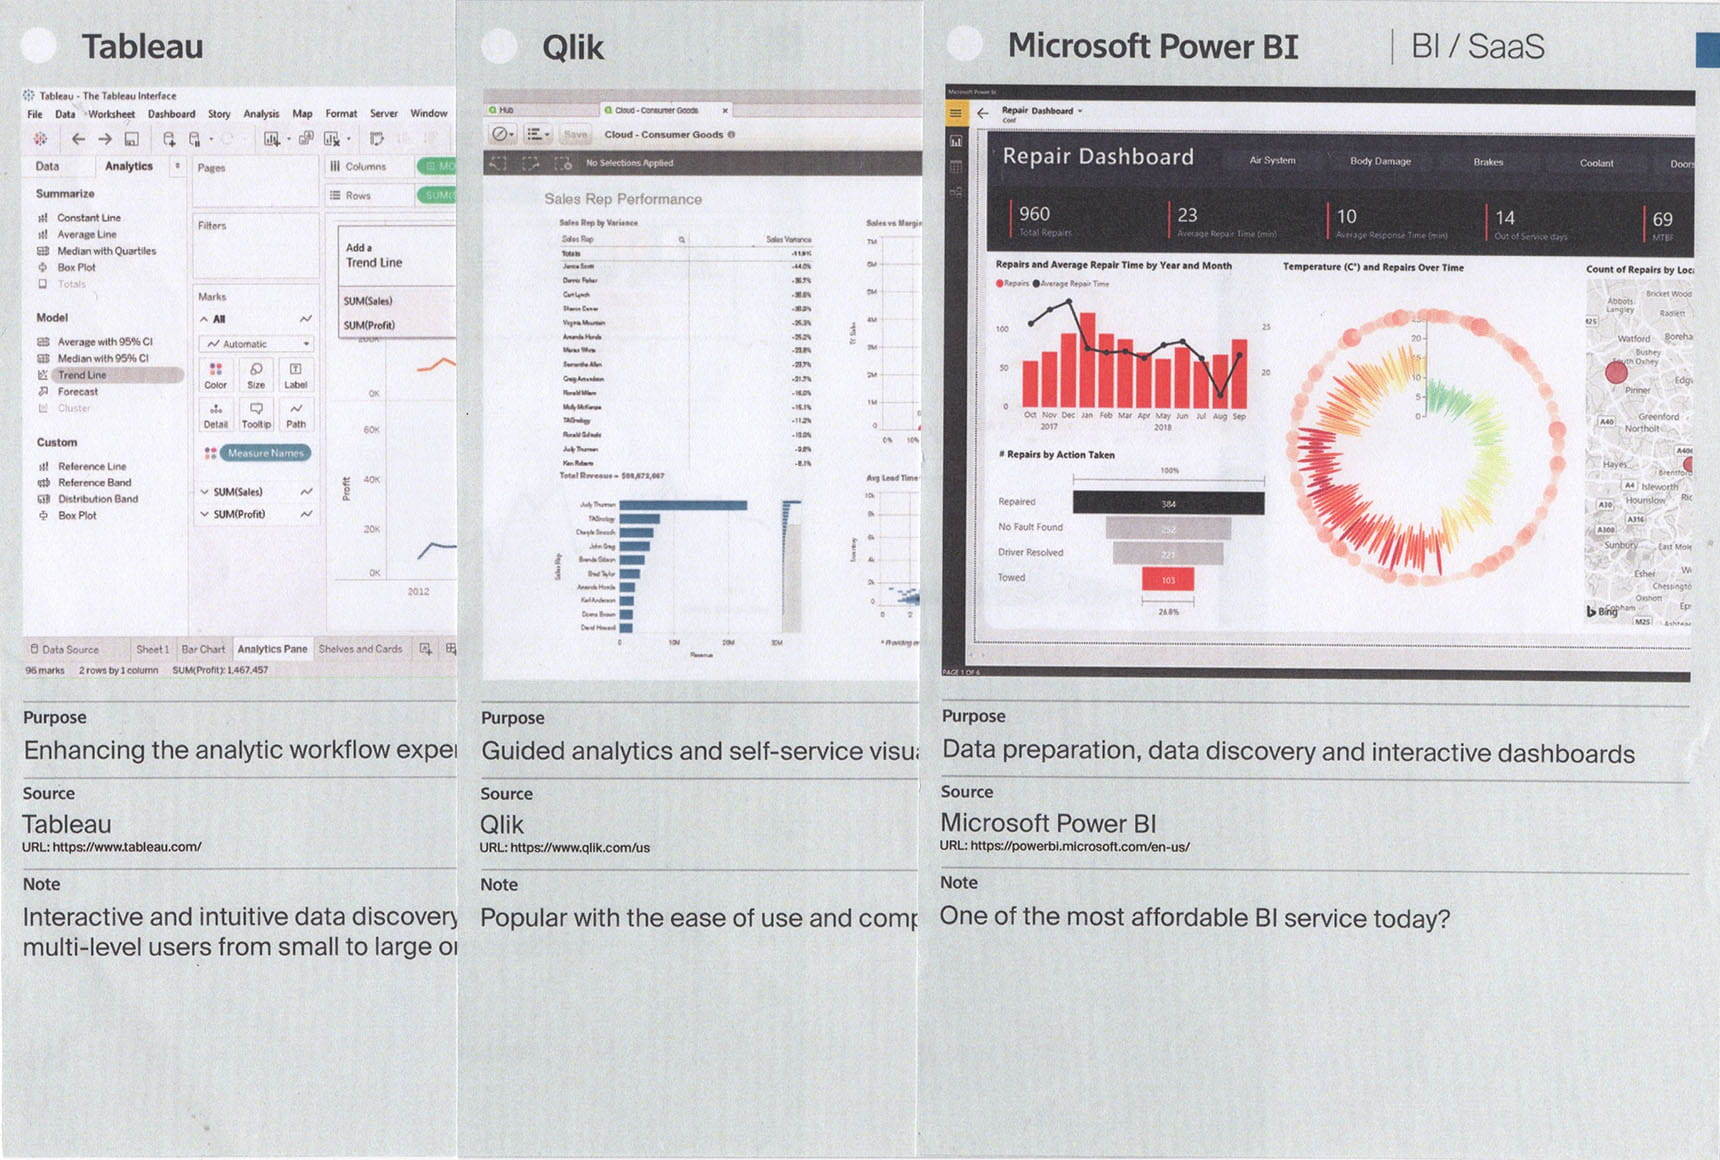
Kyoto Overtourism Web App
This web application was designed and developed to visualize crowd density data (location and time) in Kyoto. It aims to support stress-free sightseeing for tourists and to help local residents identify when and where crowded conditions may occur. The app was built using Svelte, with D3.js and Leaflet.js for the data visualization components.
HTML · CSS · JavaScript · Svelte · D3 · Leaflet · QGIS · Figma · Illustrator

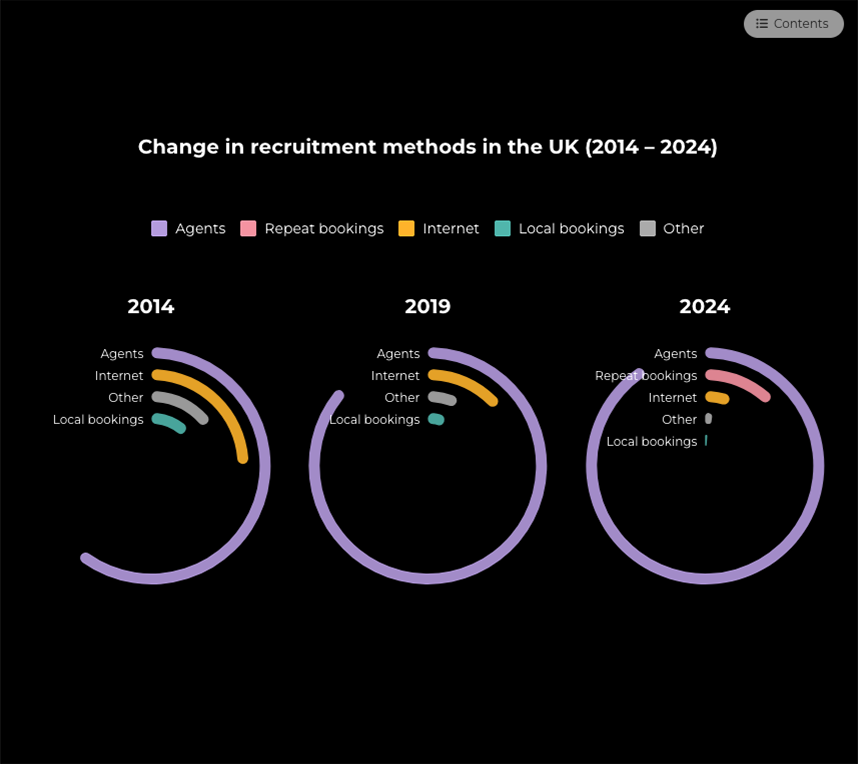
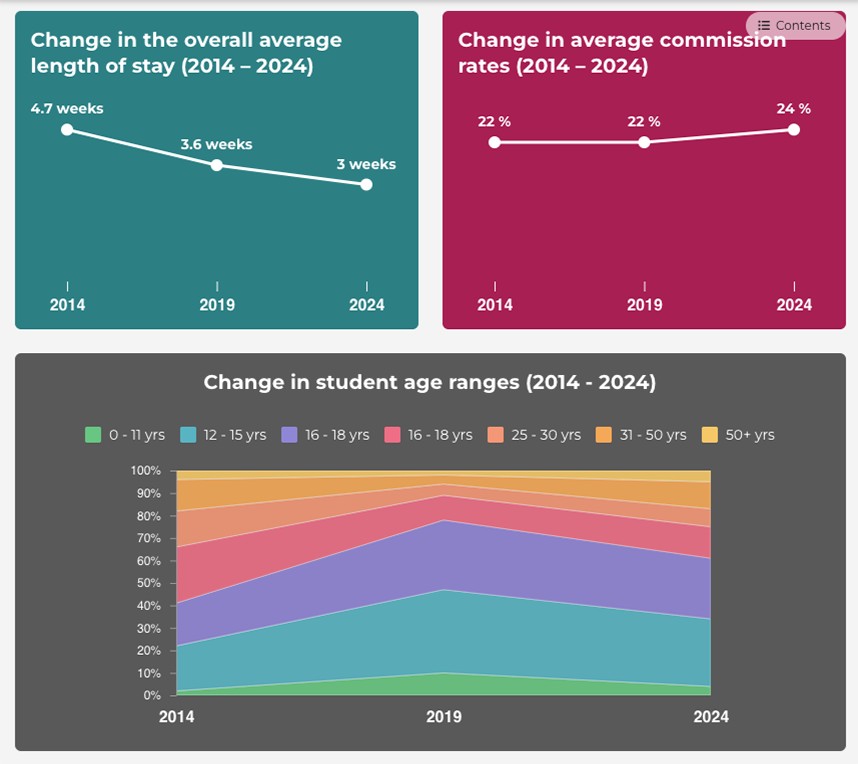
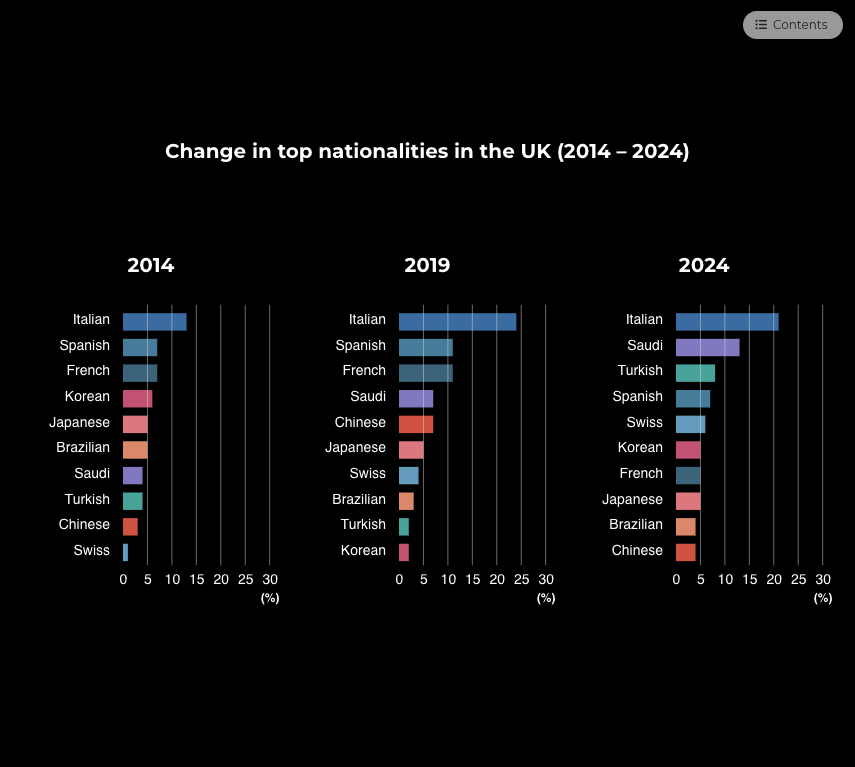
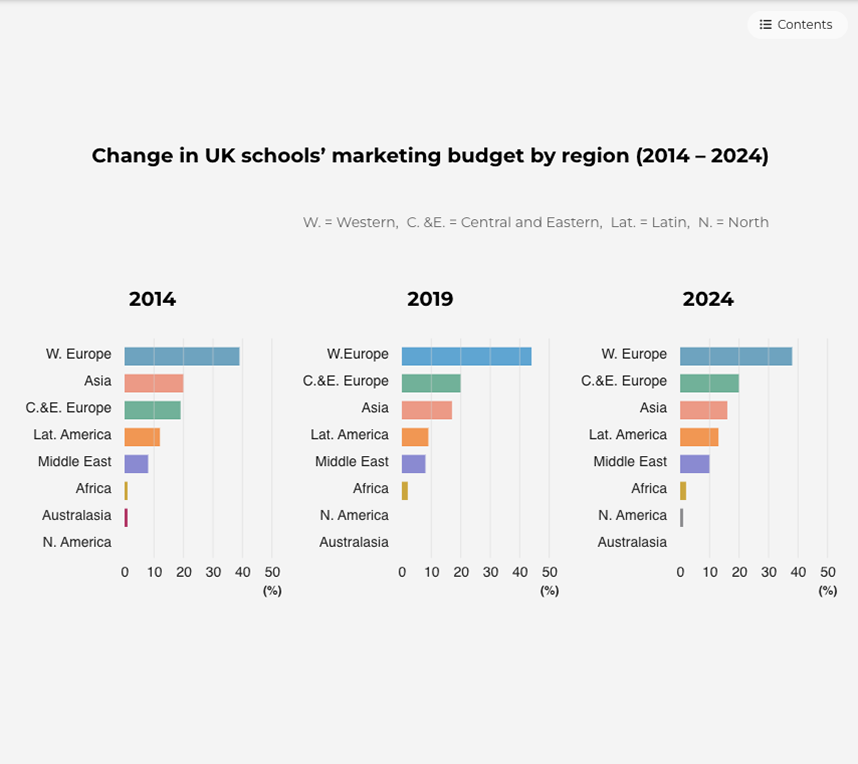
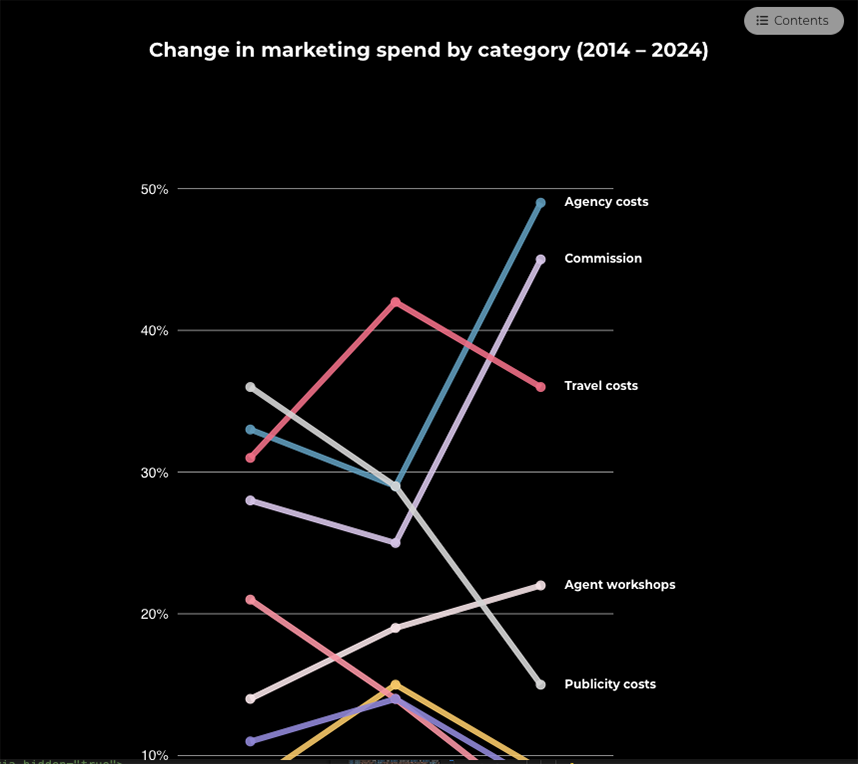
Scrollytelling
An animated scrollytelling website designed and developed to present information about studying abroad for an educational institute in the UK. The site was built with Angular, integrating D3 for data visualization and Scrollama.js for the scrollytelling interactions.
HTML · CSS · JavaScript · Angular · D3 · Figma
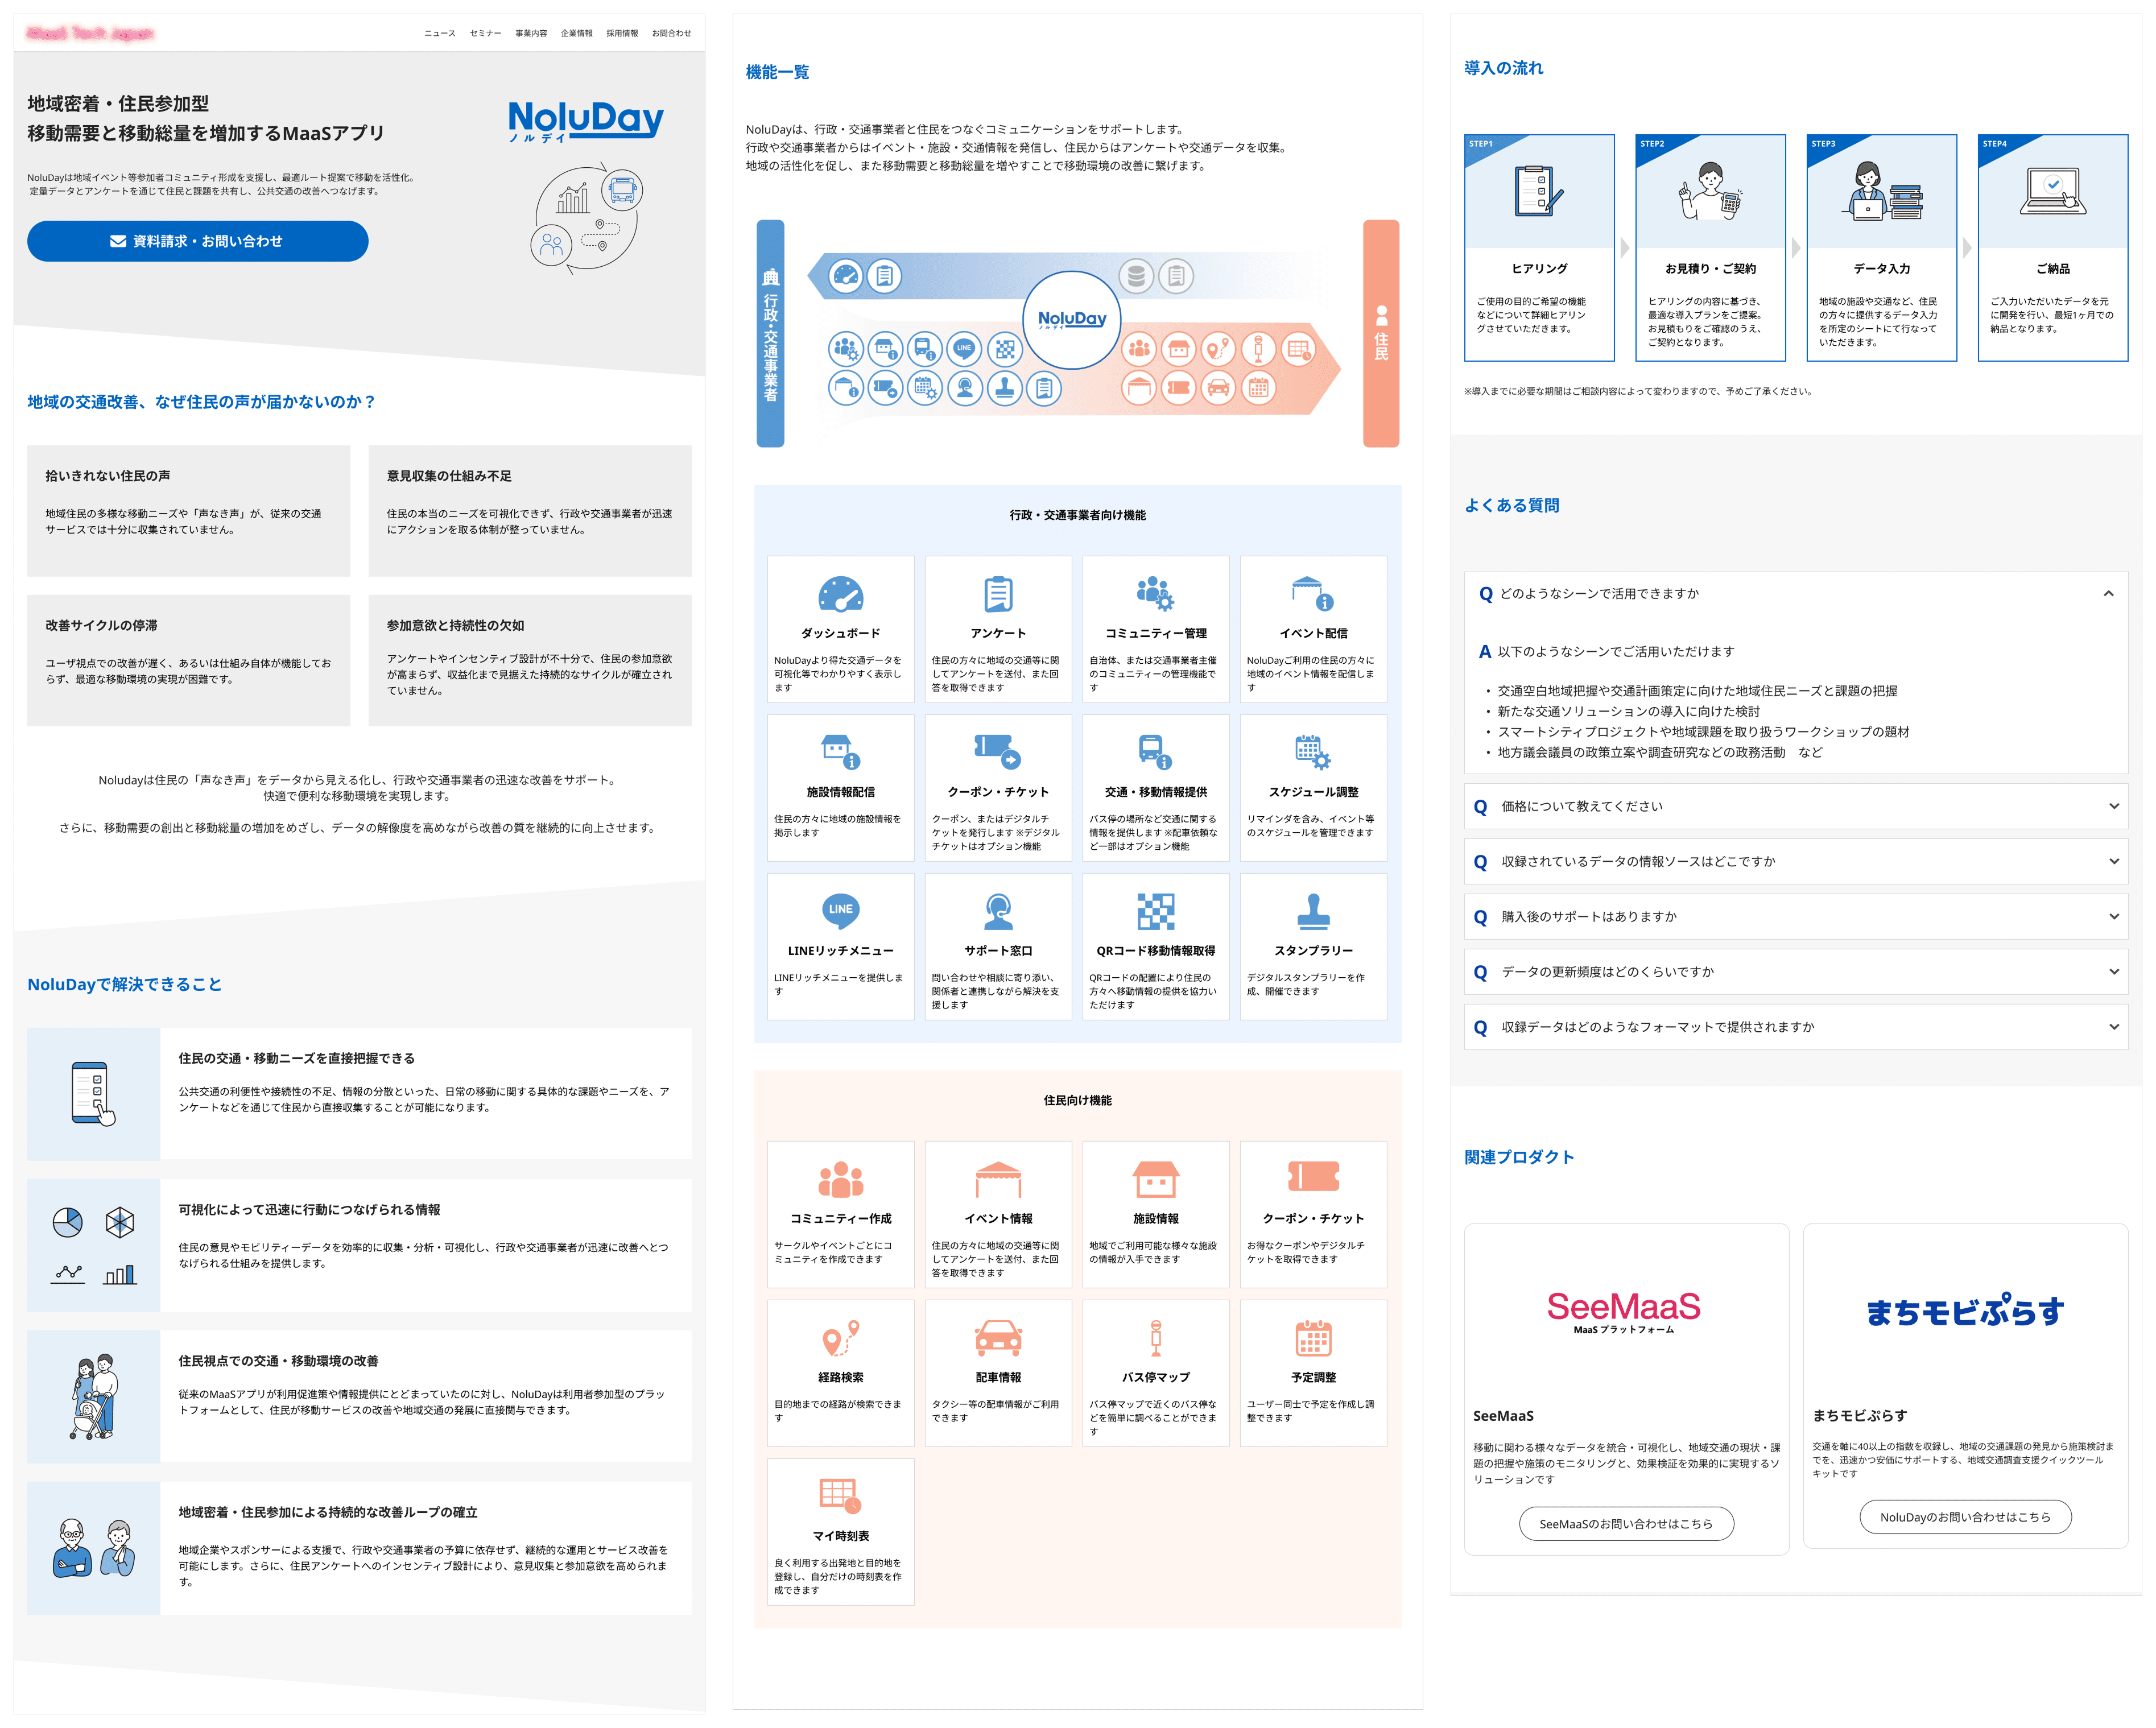
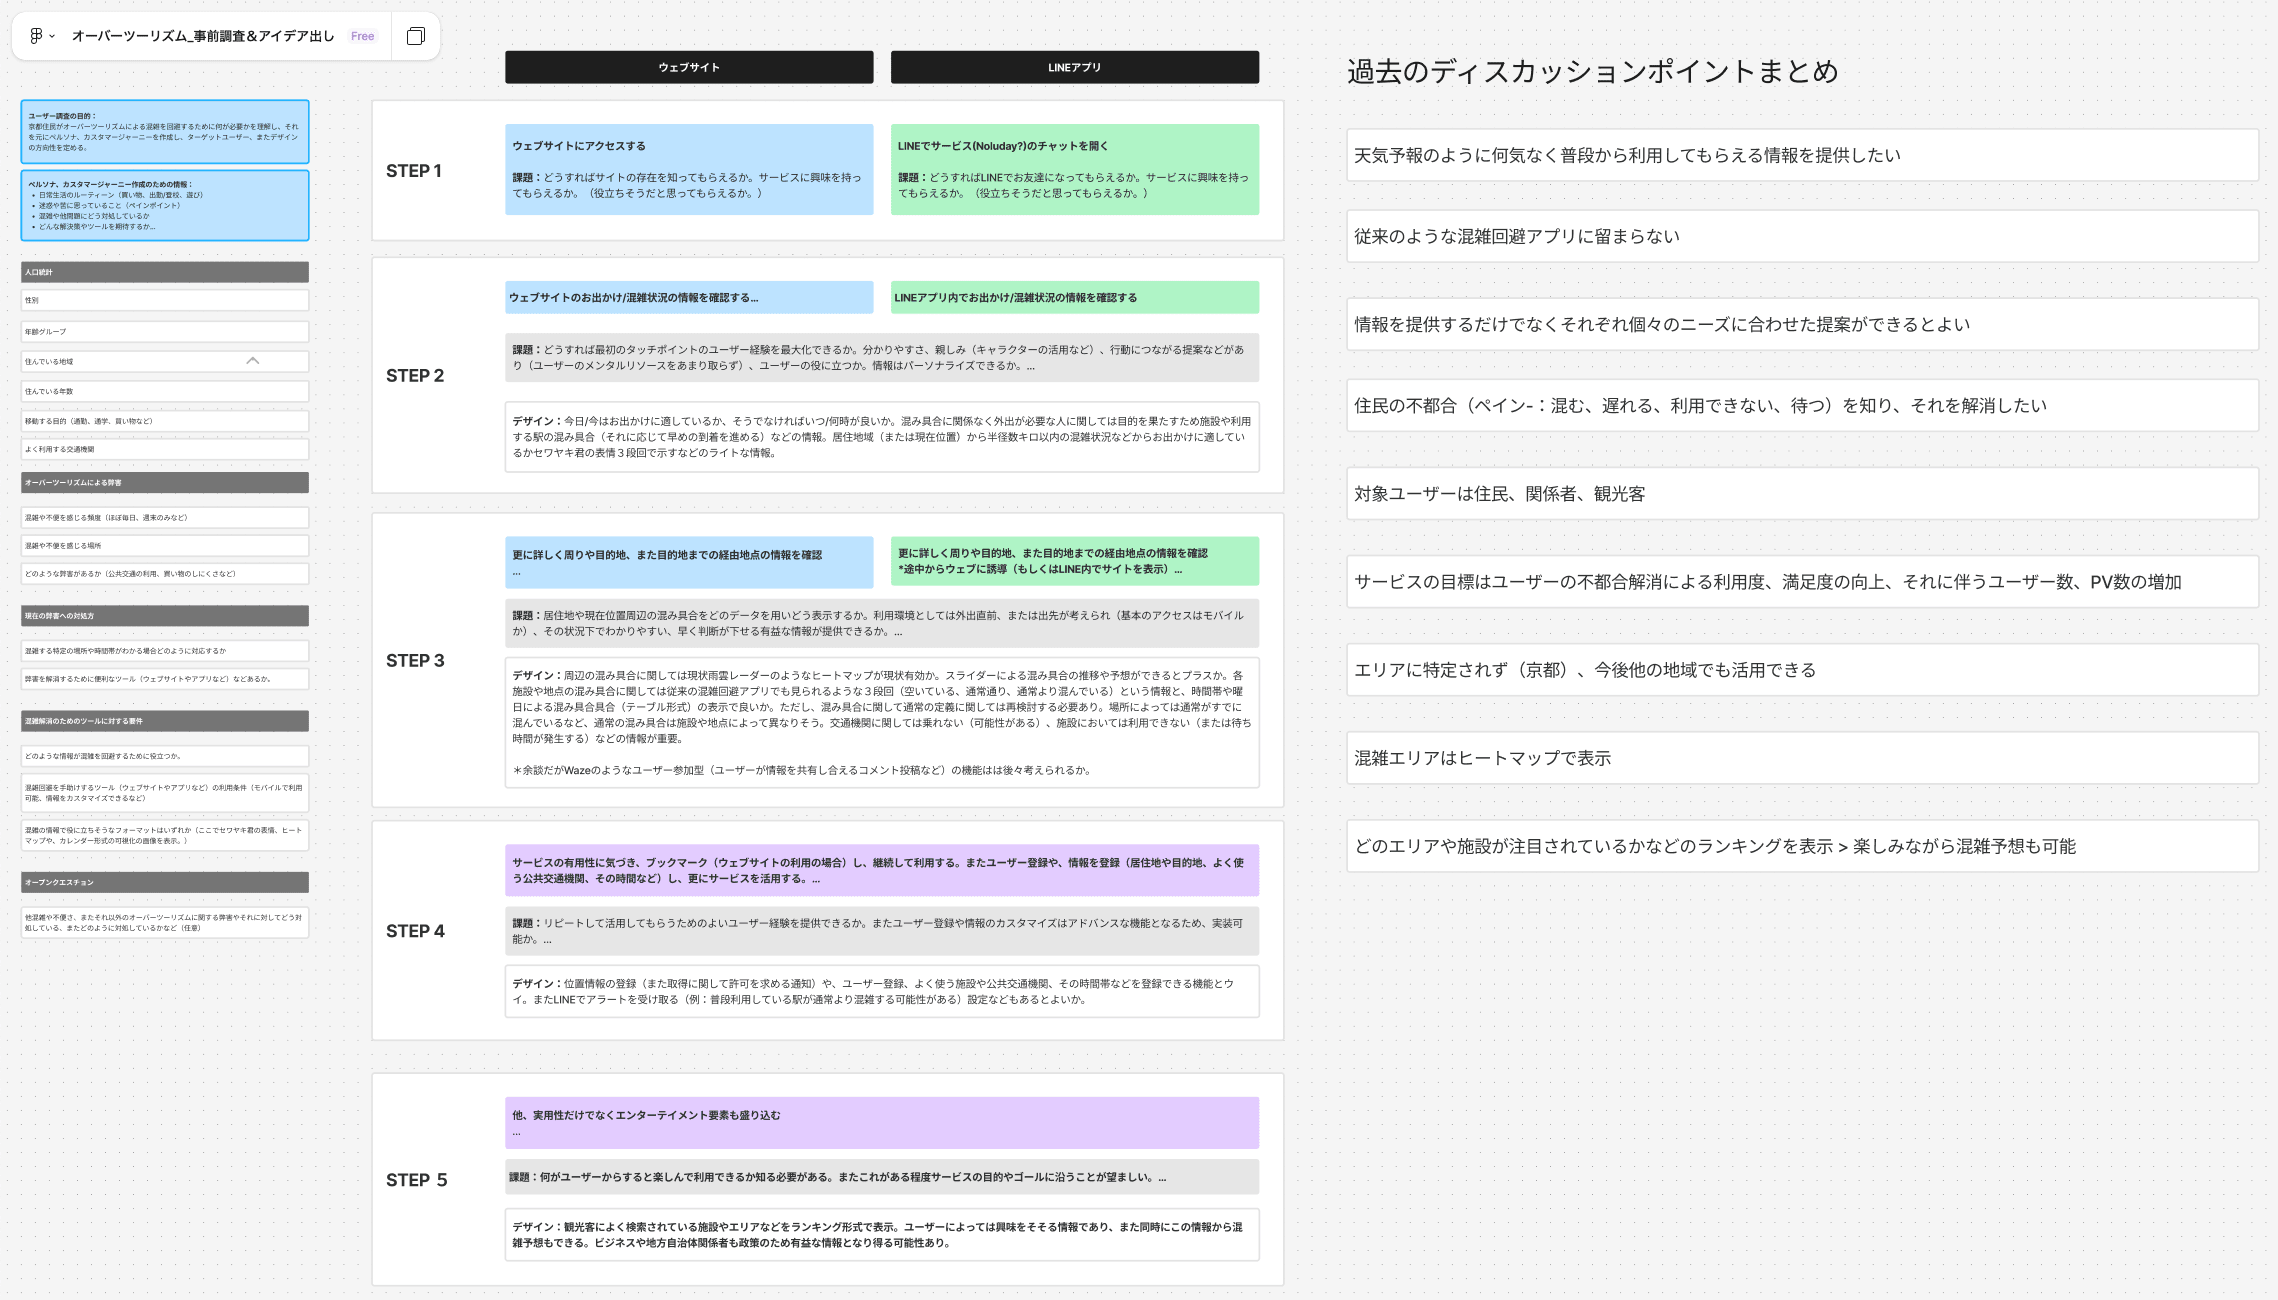
Landing Page for MaaS Platform
A landing page designed for a Mobility as a Service (MaaS) platform, offered as a LINE mini-app, helps communities share feedback and mobility needs directly with local governments and transport operators.
Figma · Illustrator · Photoshop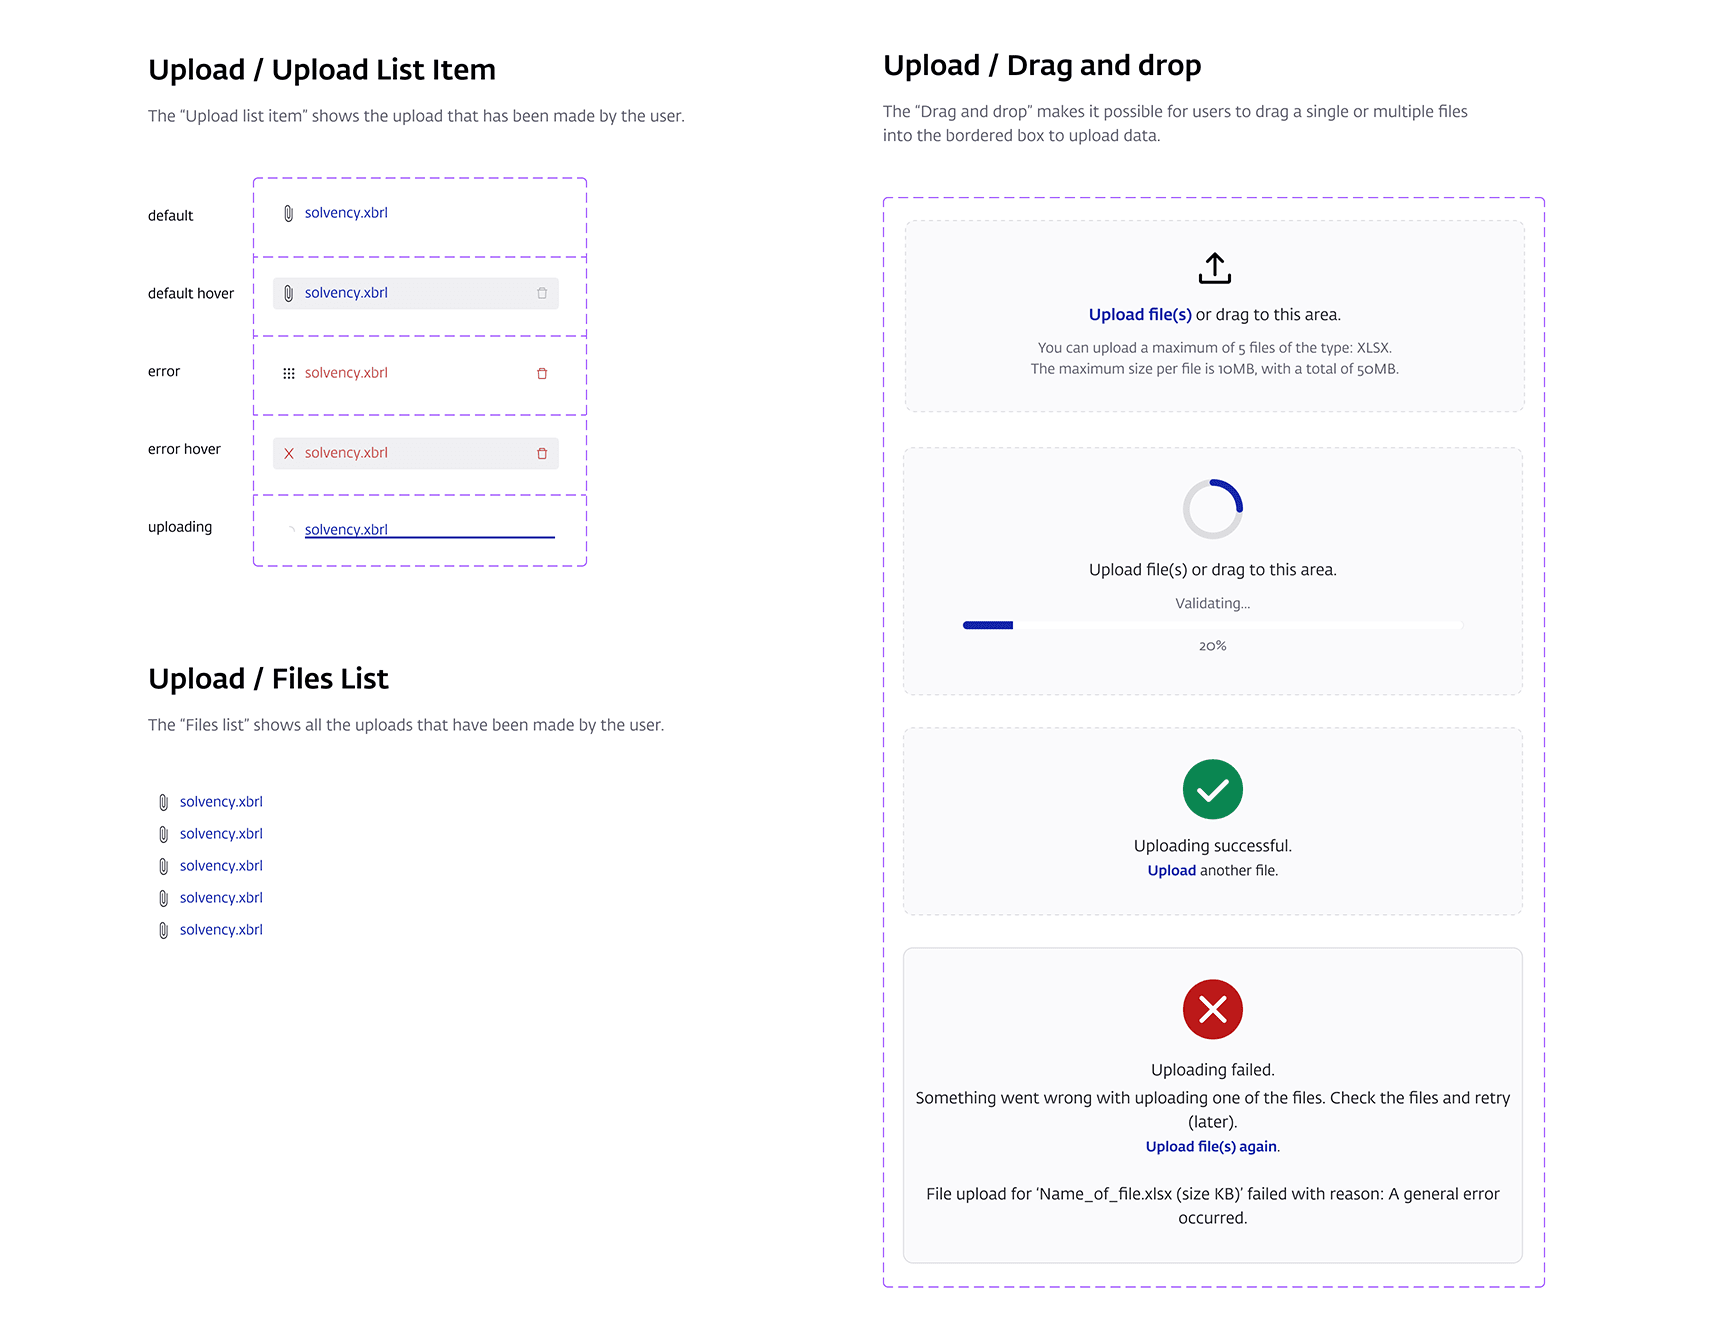
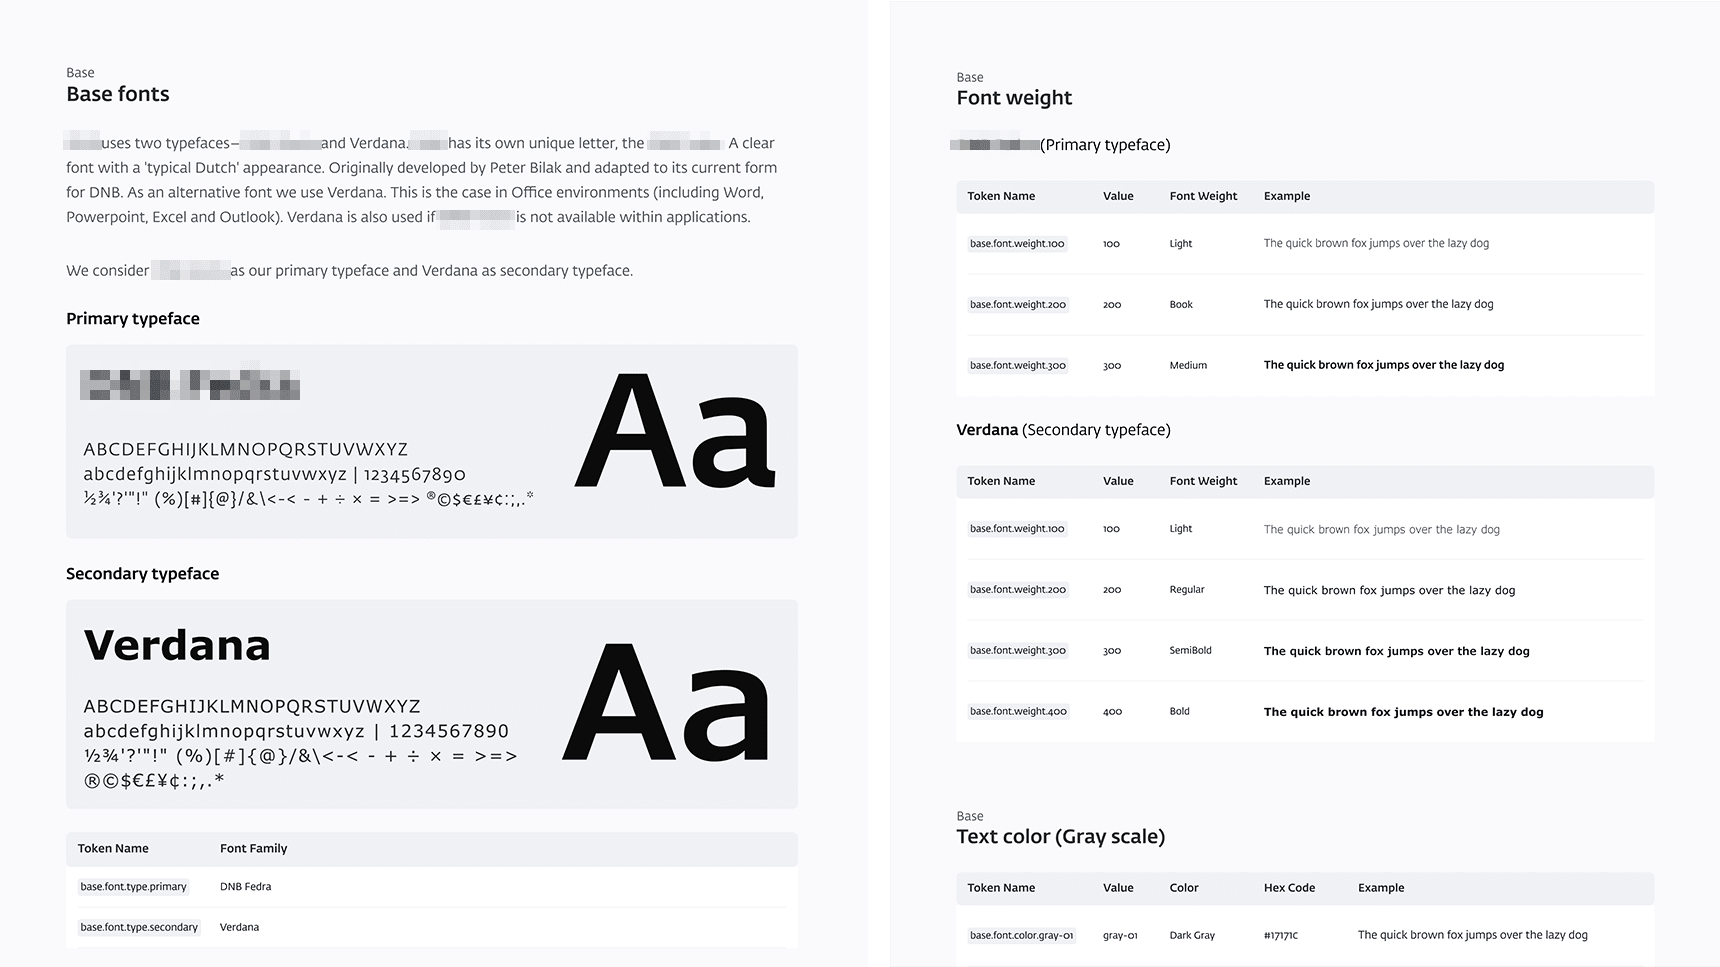
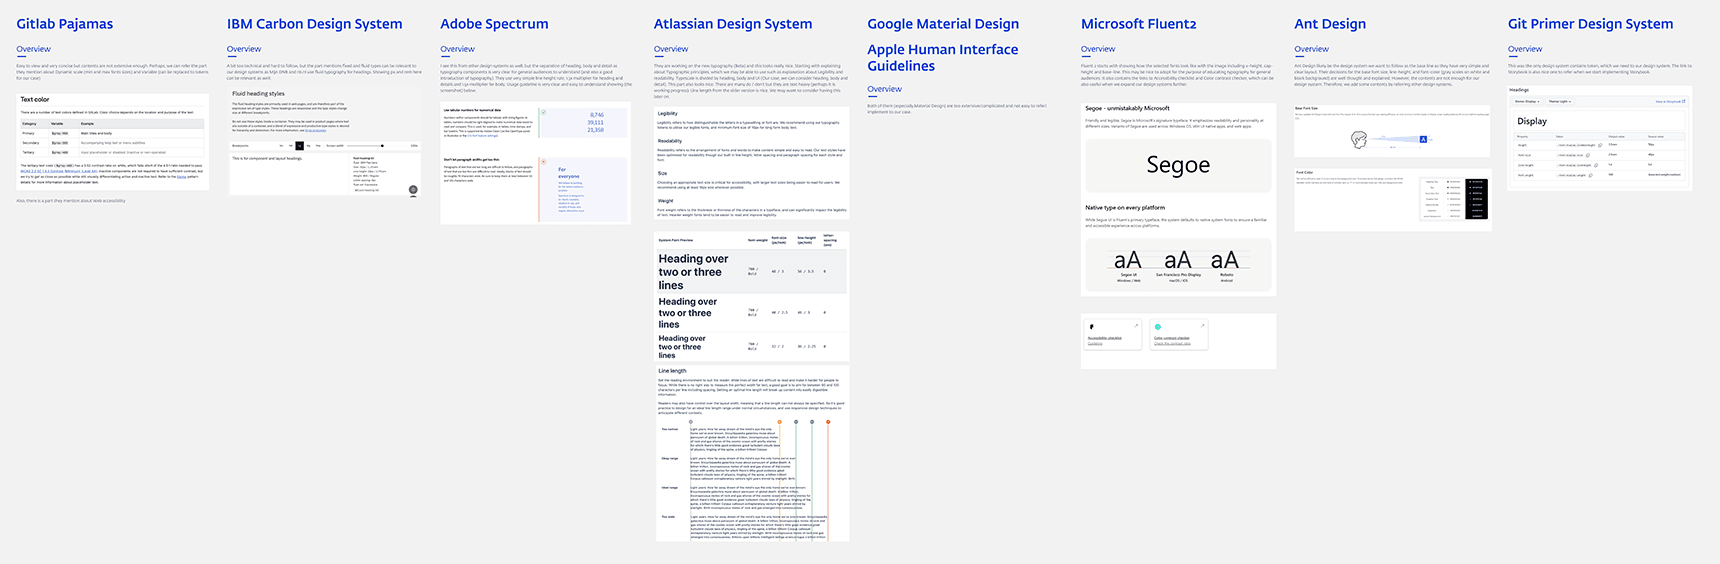
Design System and Component Library
Collaborating with other UX designers at the Central Bank of the Netherlands, I contributed to building a design system, specifically focusing on the typography. I also played a role in creating several components, beginning with research on major design systems in the market.
Figma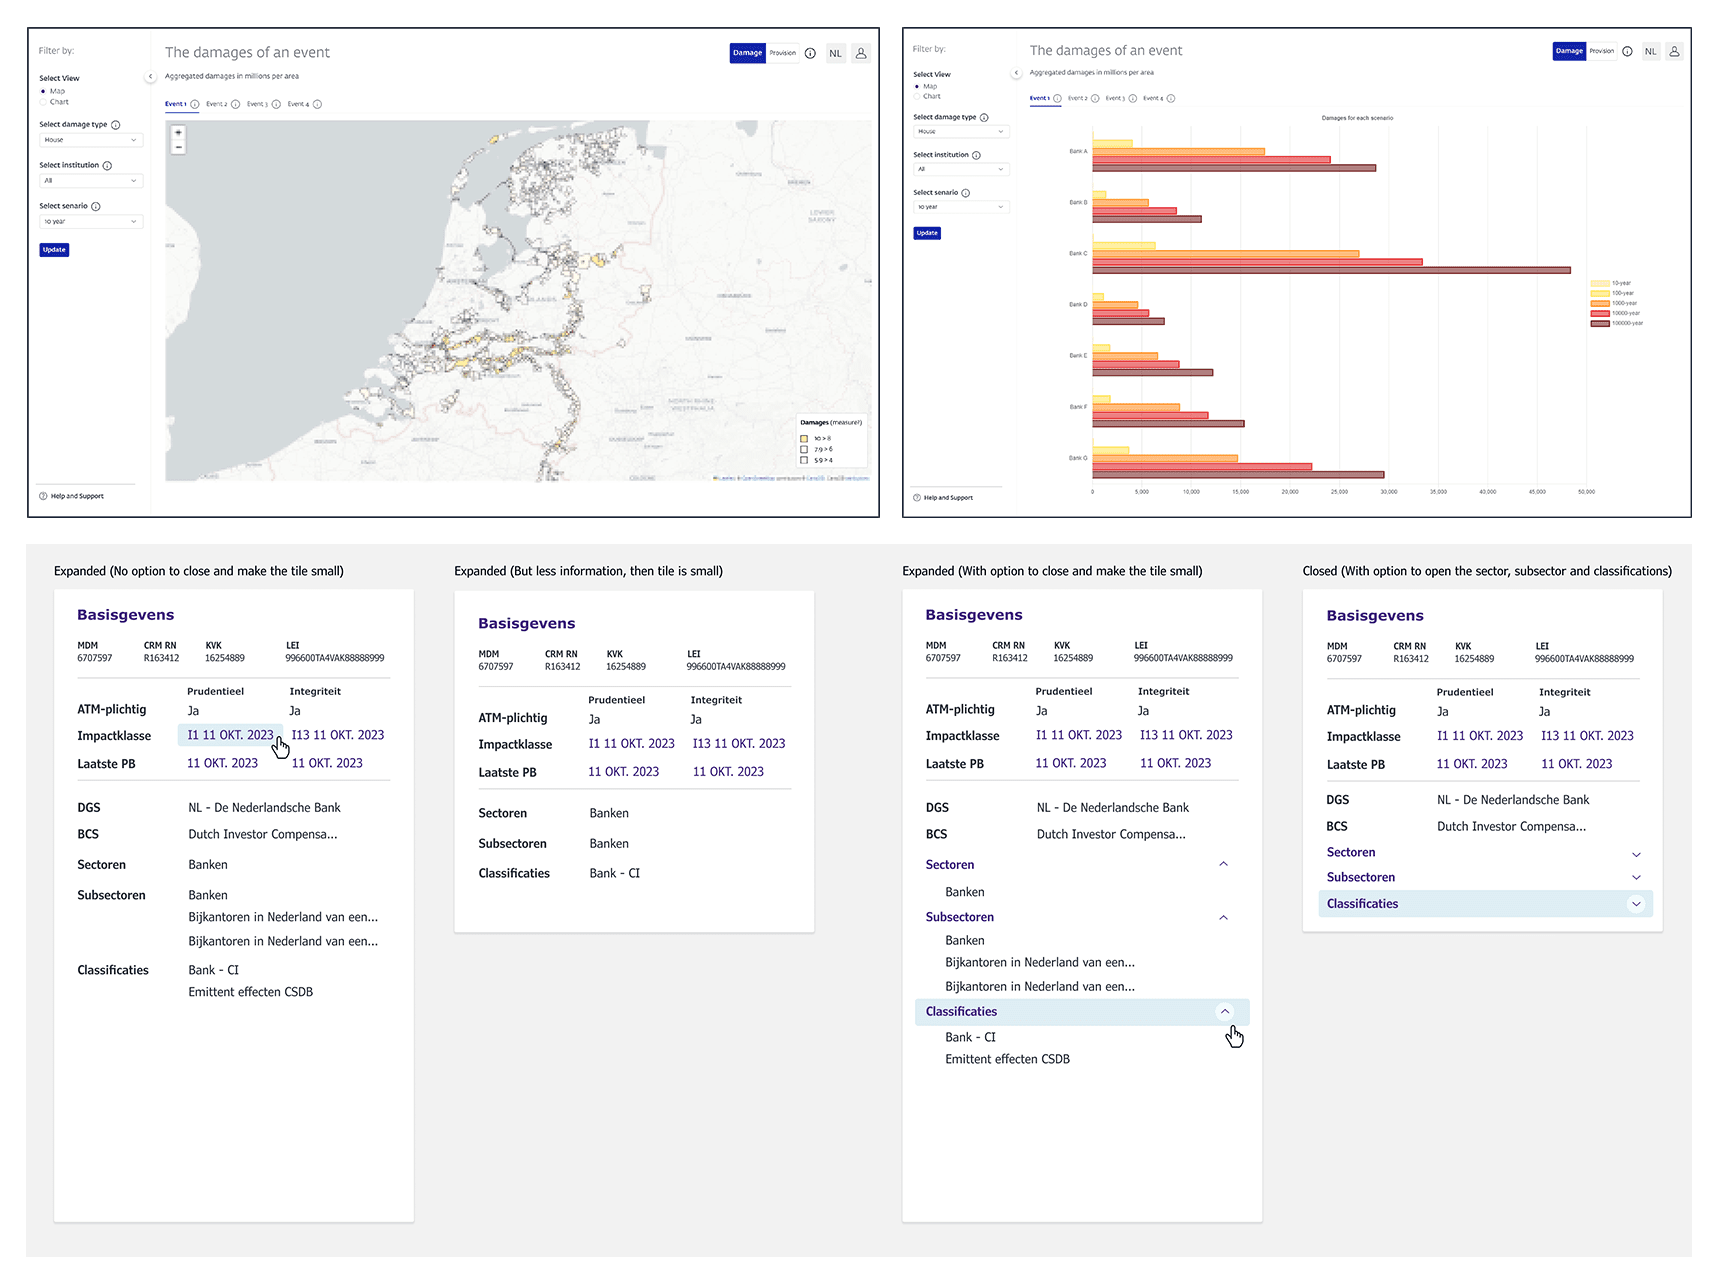
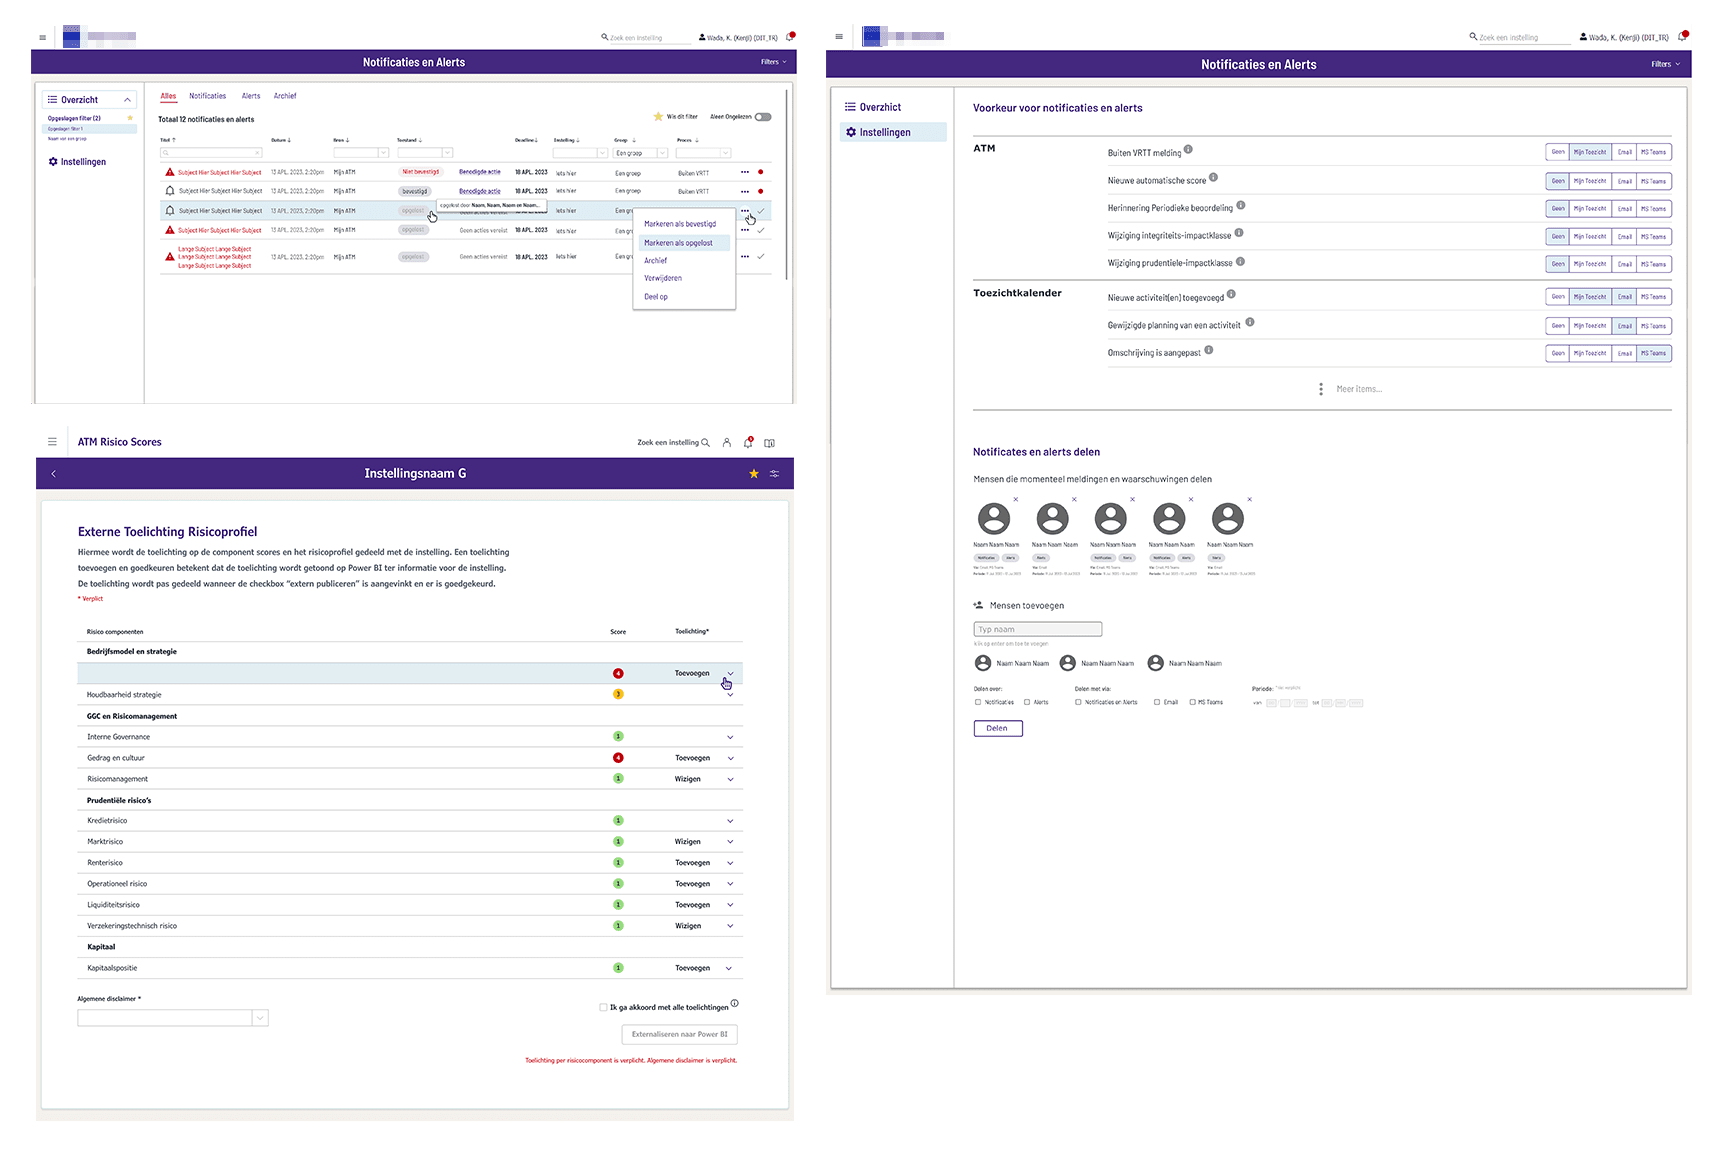
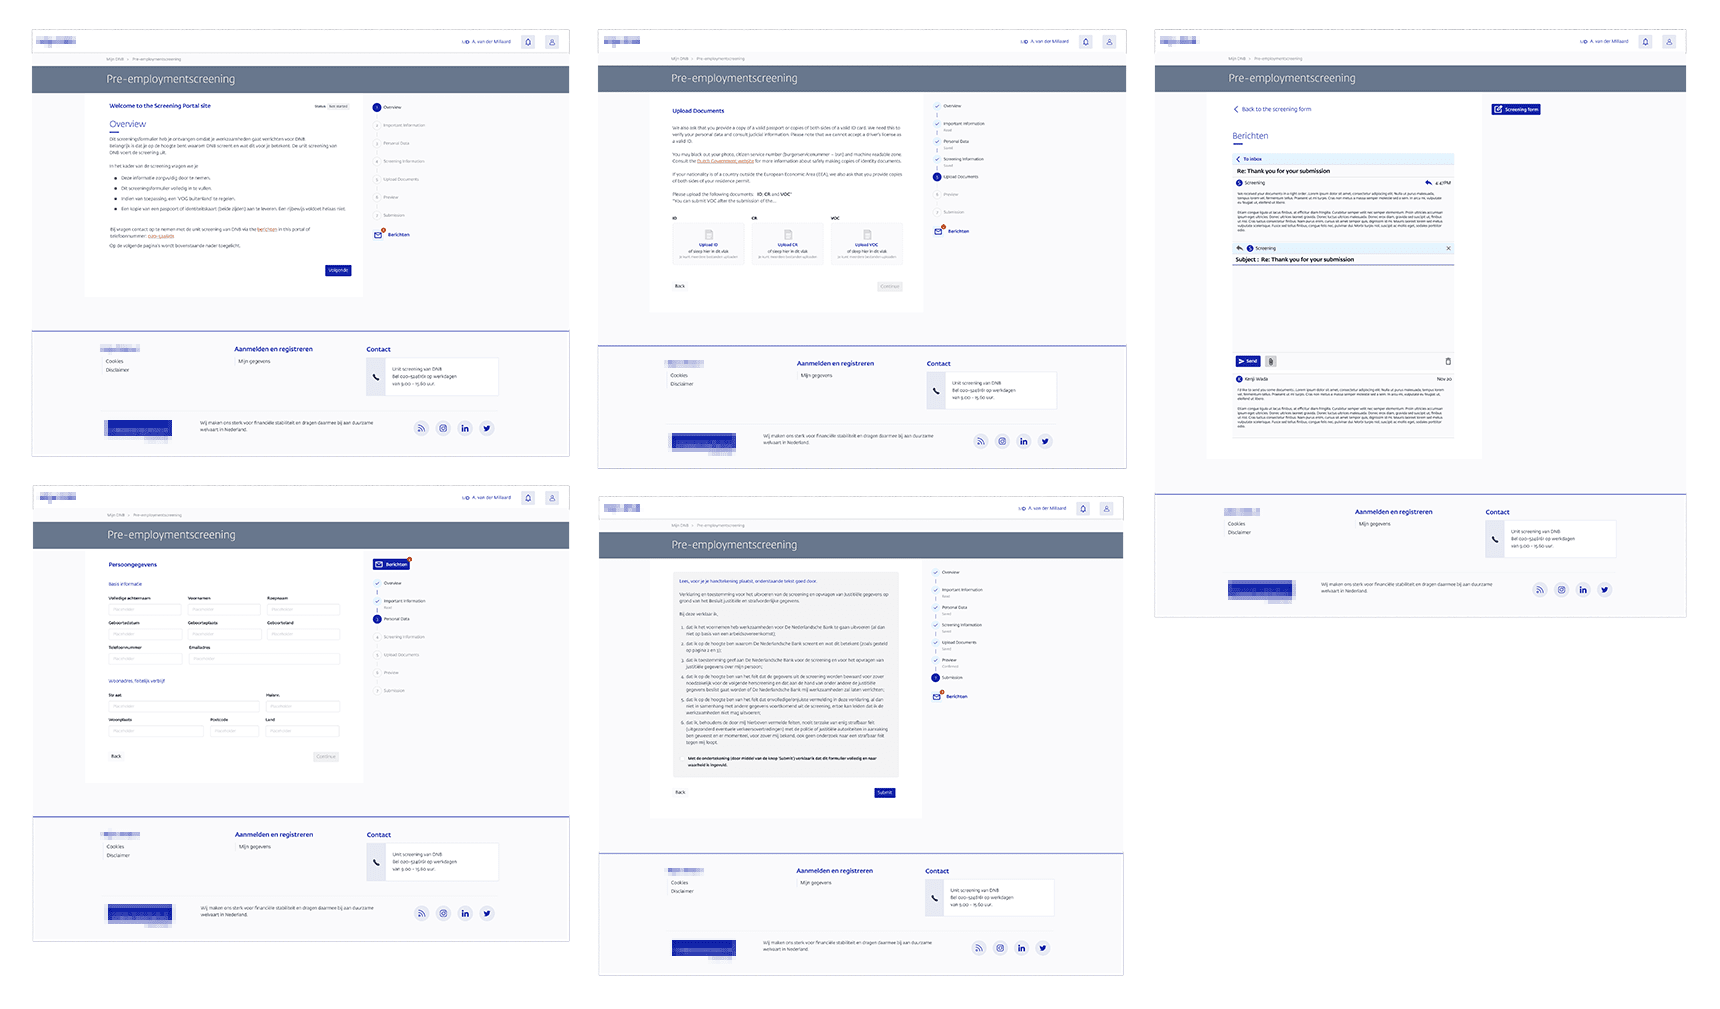
Internal (Banking) & External Applications
I worked on a variety of internal (banking) and external application UX/UI designs for the Central Bank of the Netherlands. Most of the internal banking applications are designed to support supervisors in ensuring the stability and integrity of the Dutch financial system.
Figma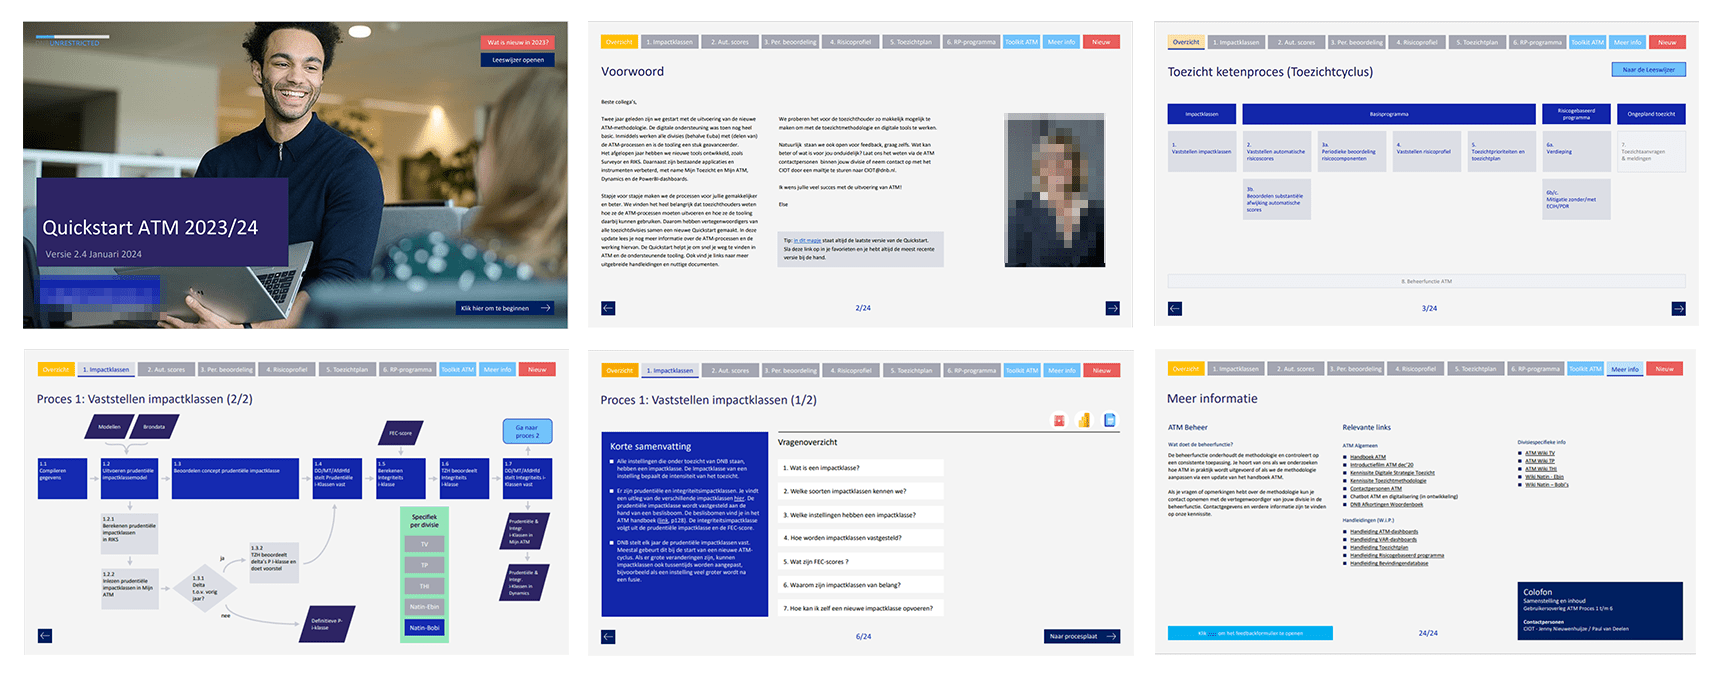
Interactive Internal Manual
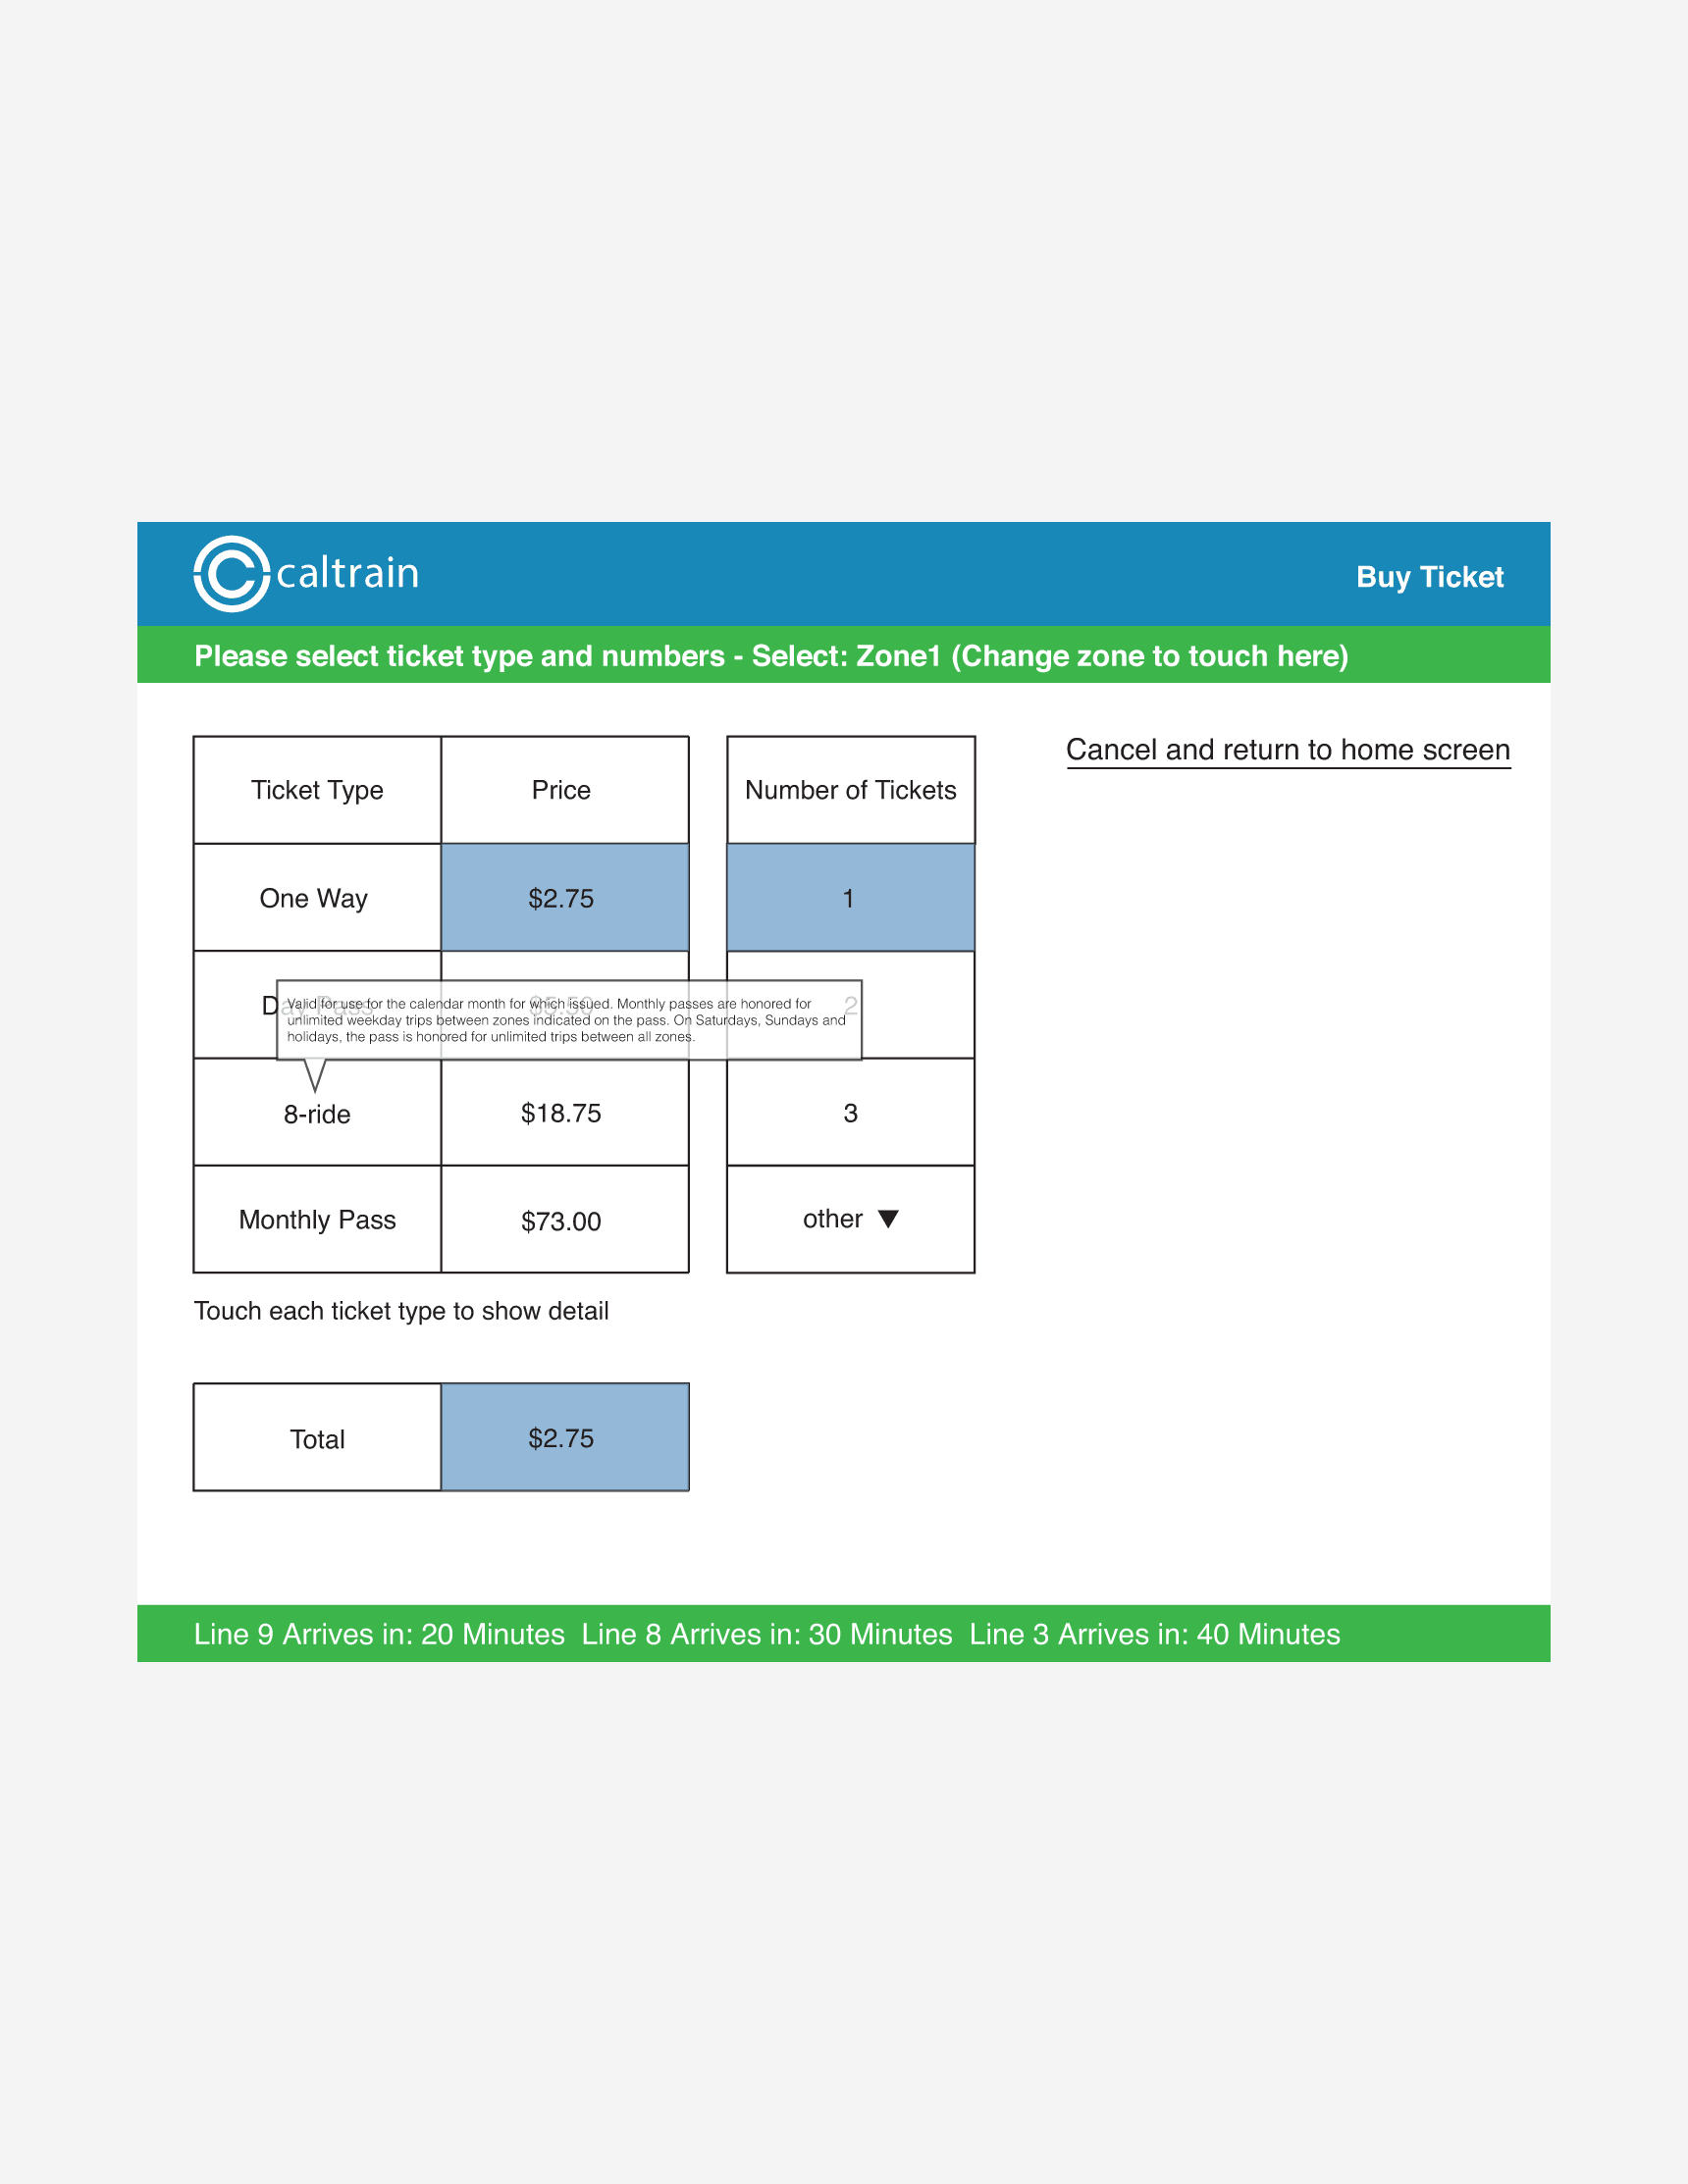
The aim of this project was to make it possible to update the internal ATM (Authorization, Transaction, and Monitoring) process manual, which had previously been outsourced. PowerPoint was chosen as the tool since most employees are familiar with it.
Illustrator · PowerPoint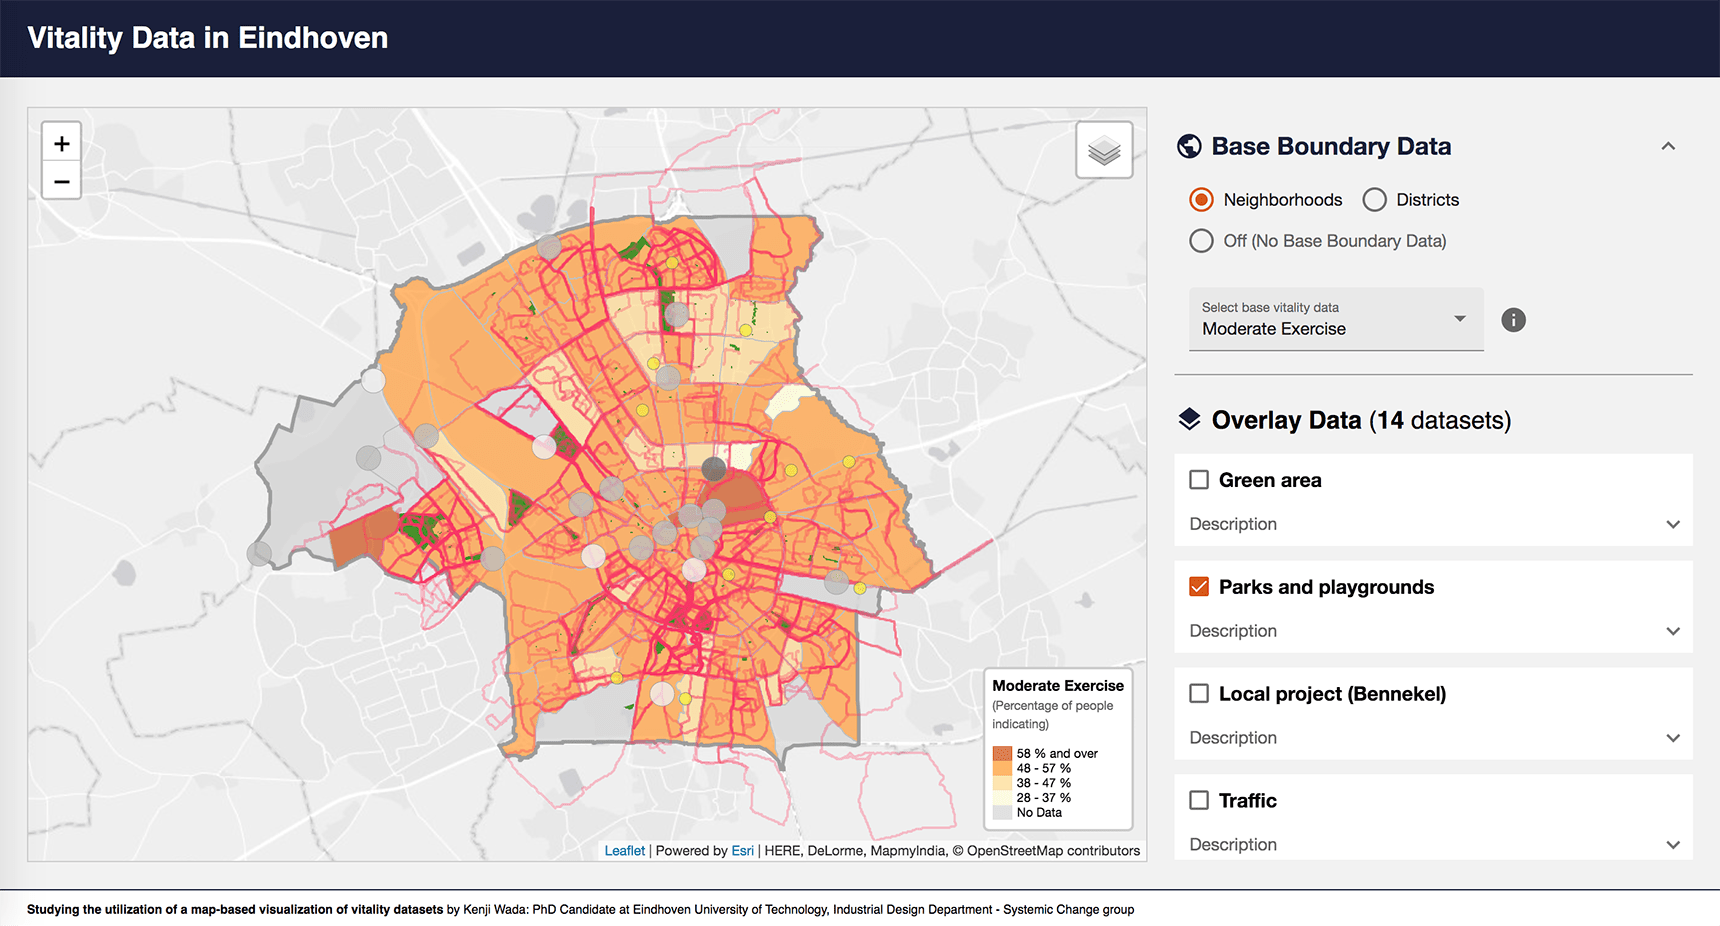
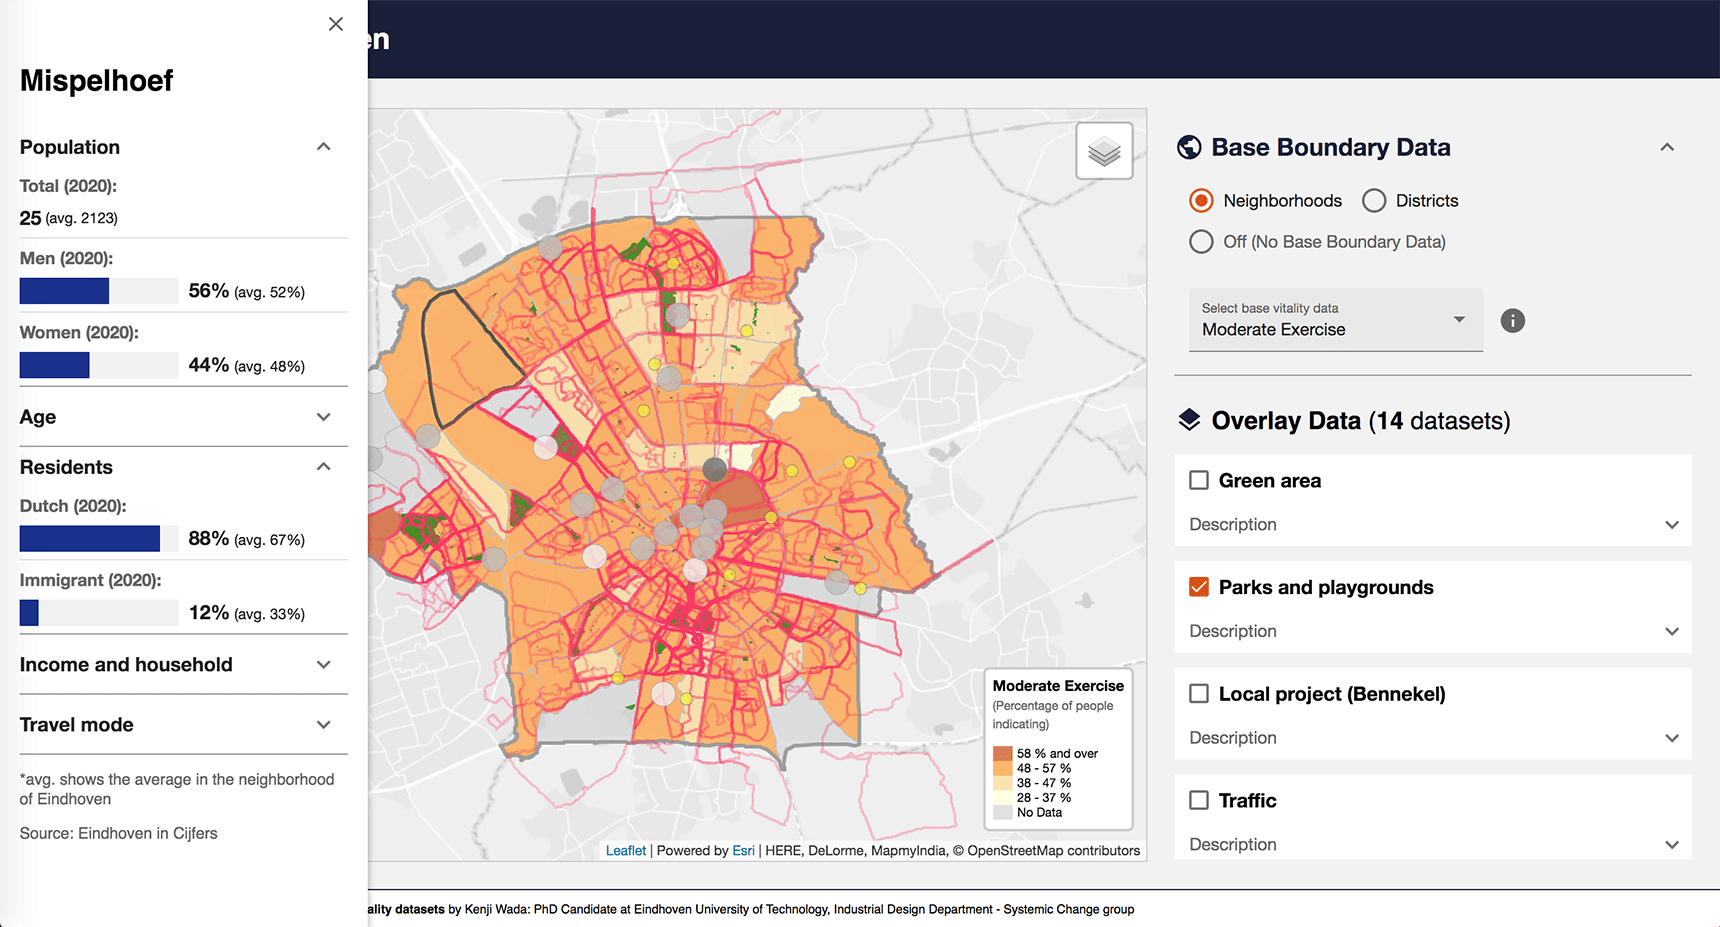
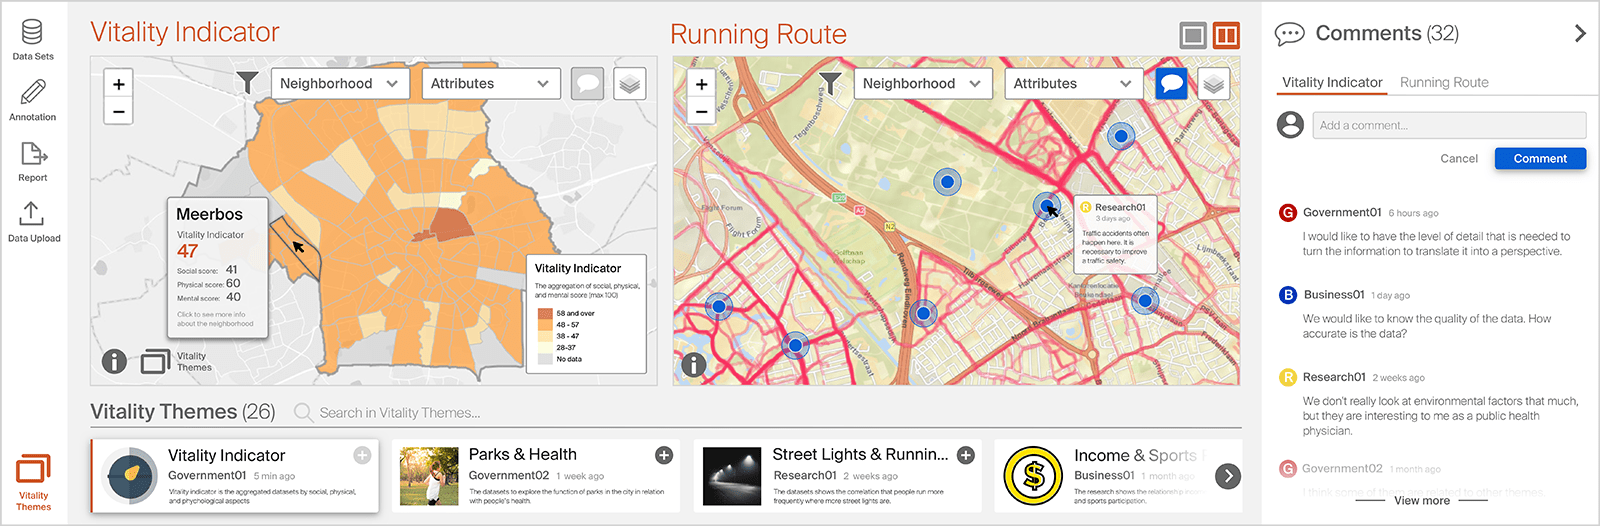
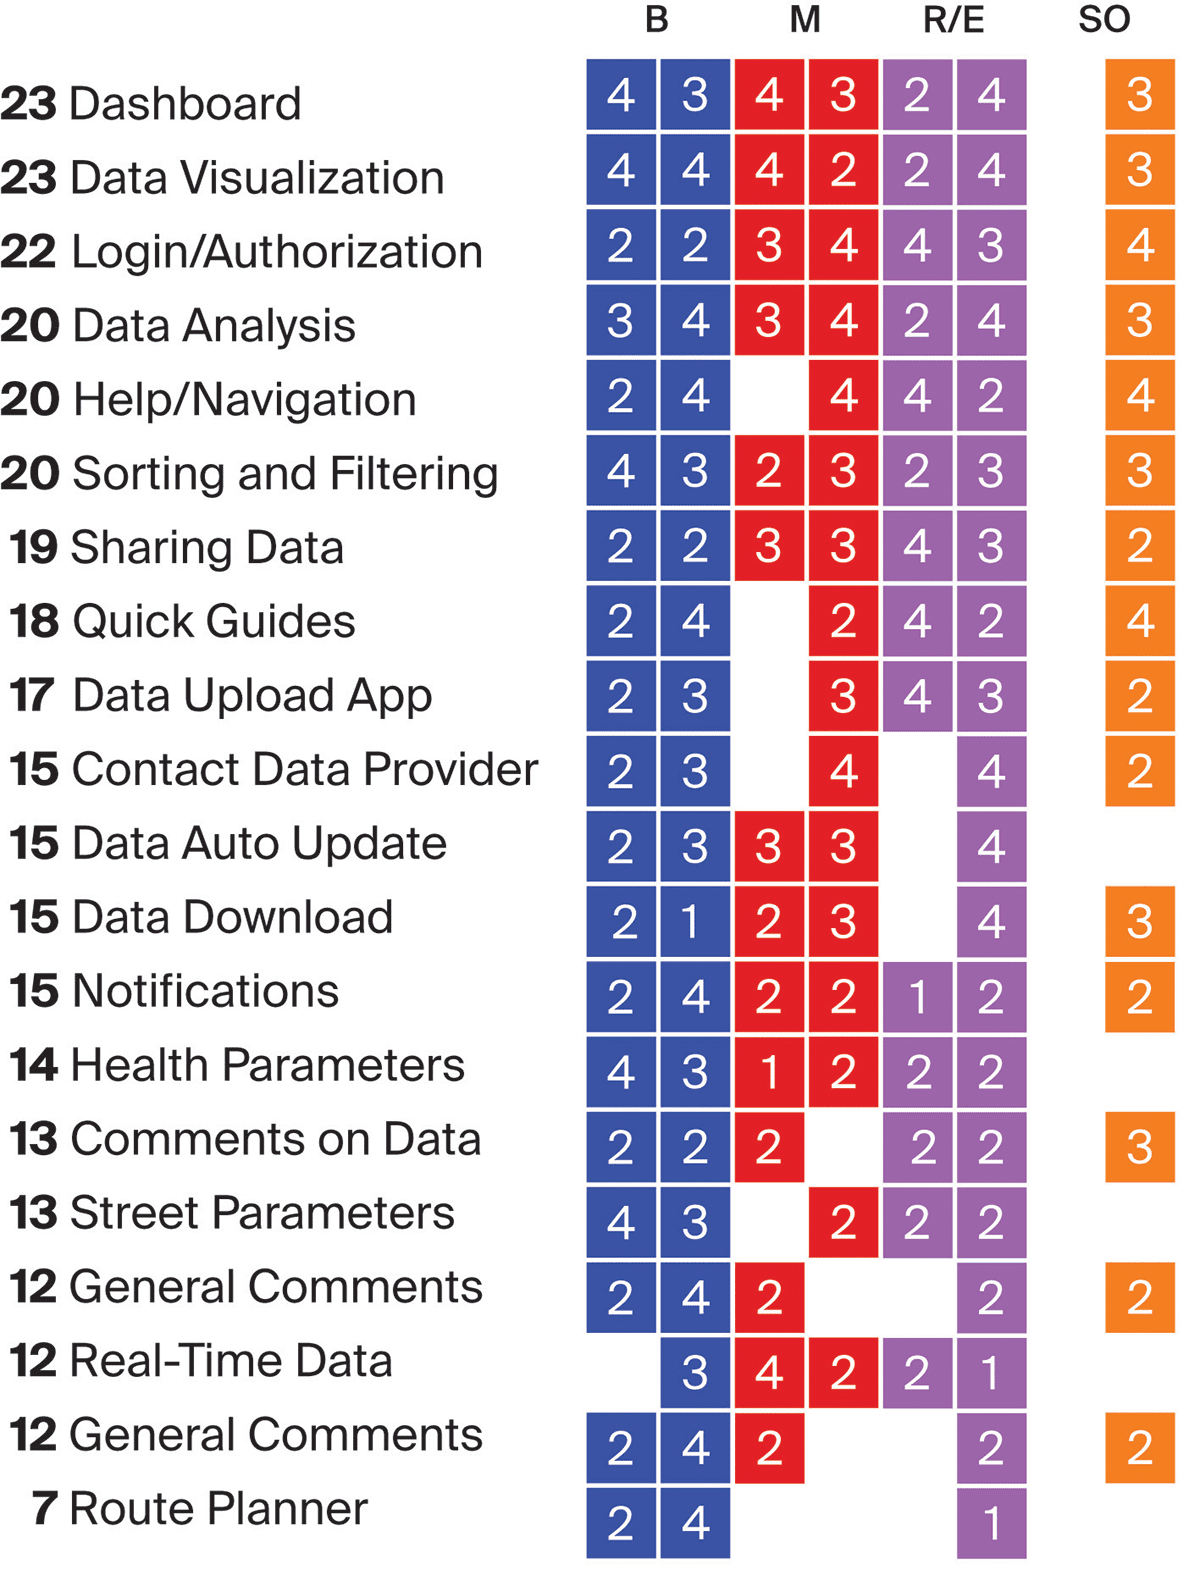
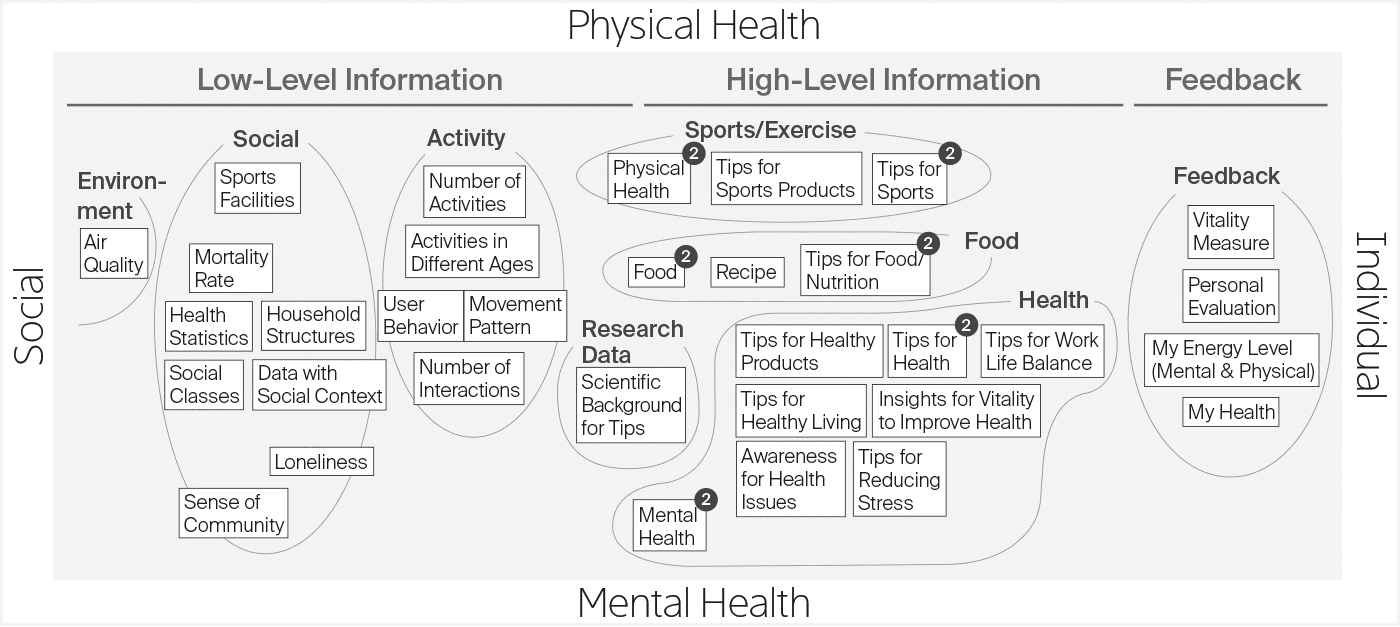
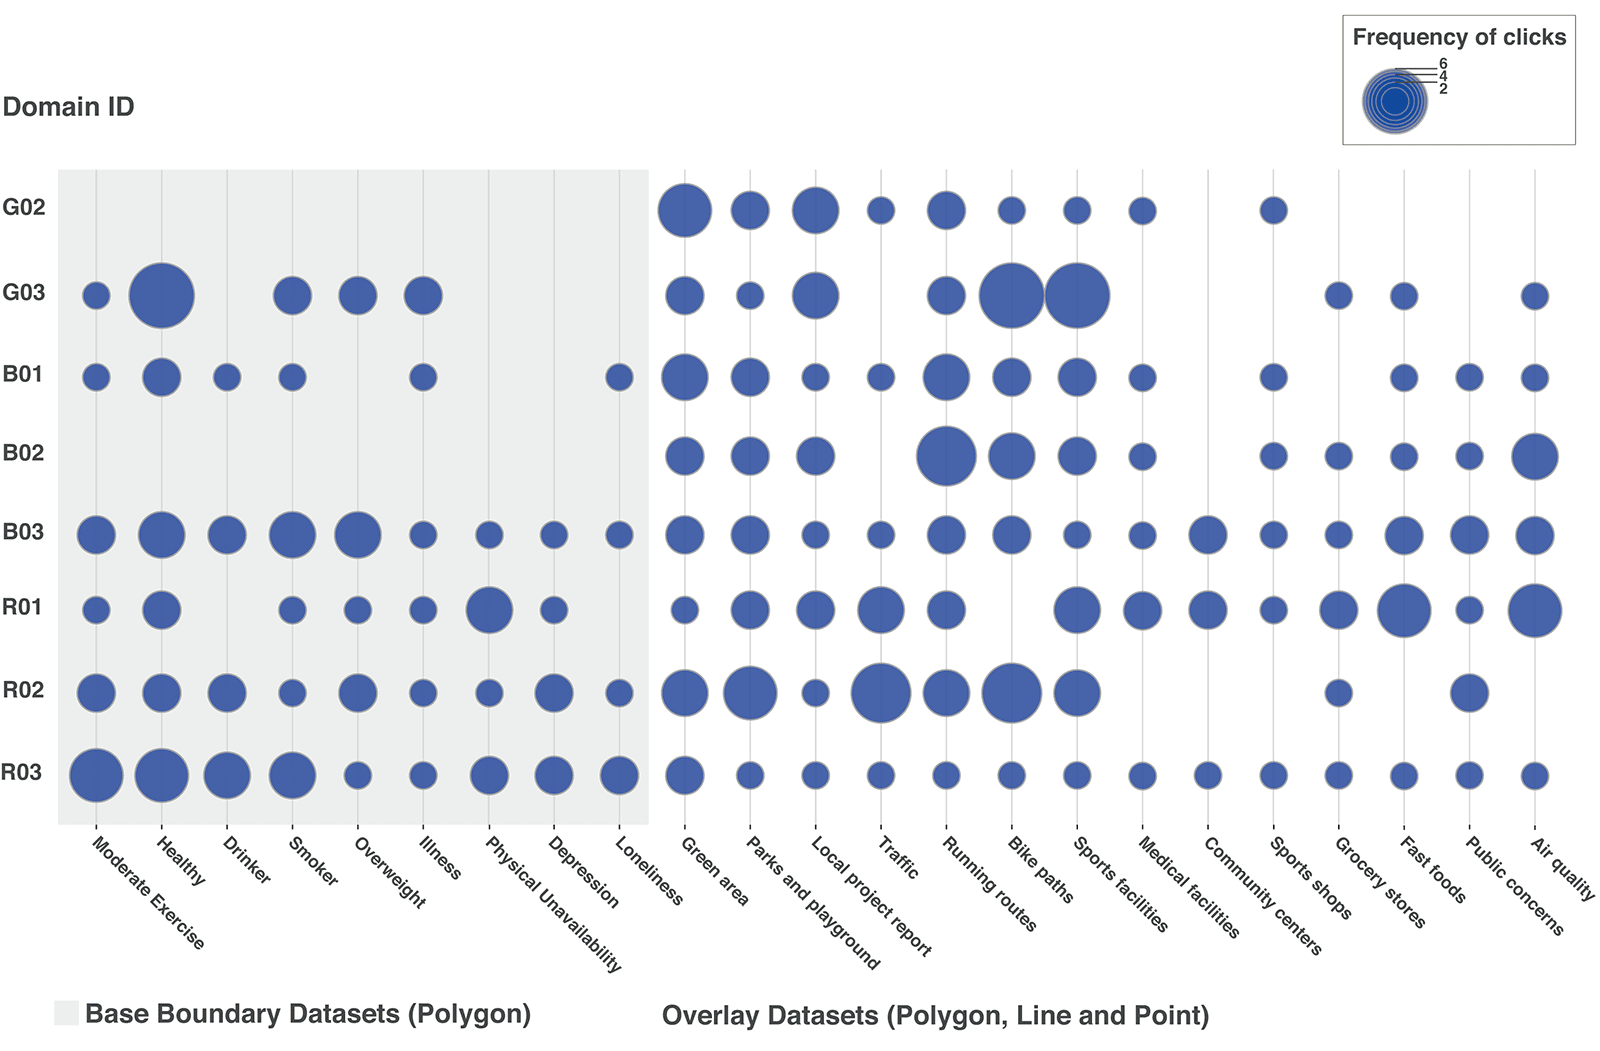
Vitality Map Visualization
Investigating the effectiveness of web cartography to support vitality-related projects, a web map application based on Node.js with JavaScript libraries—D3 and Leaflet, was developed for an experiment.
HTML · CSS · JavaScript · Angular · D3 · Leaflet · ArcGIS · QGIS · R · Illustrator · Sketch
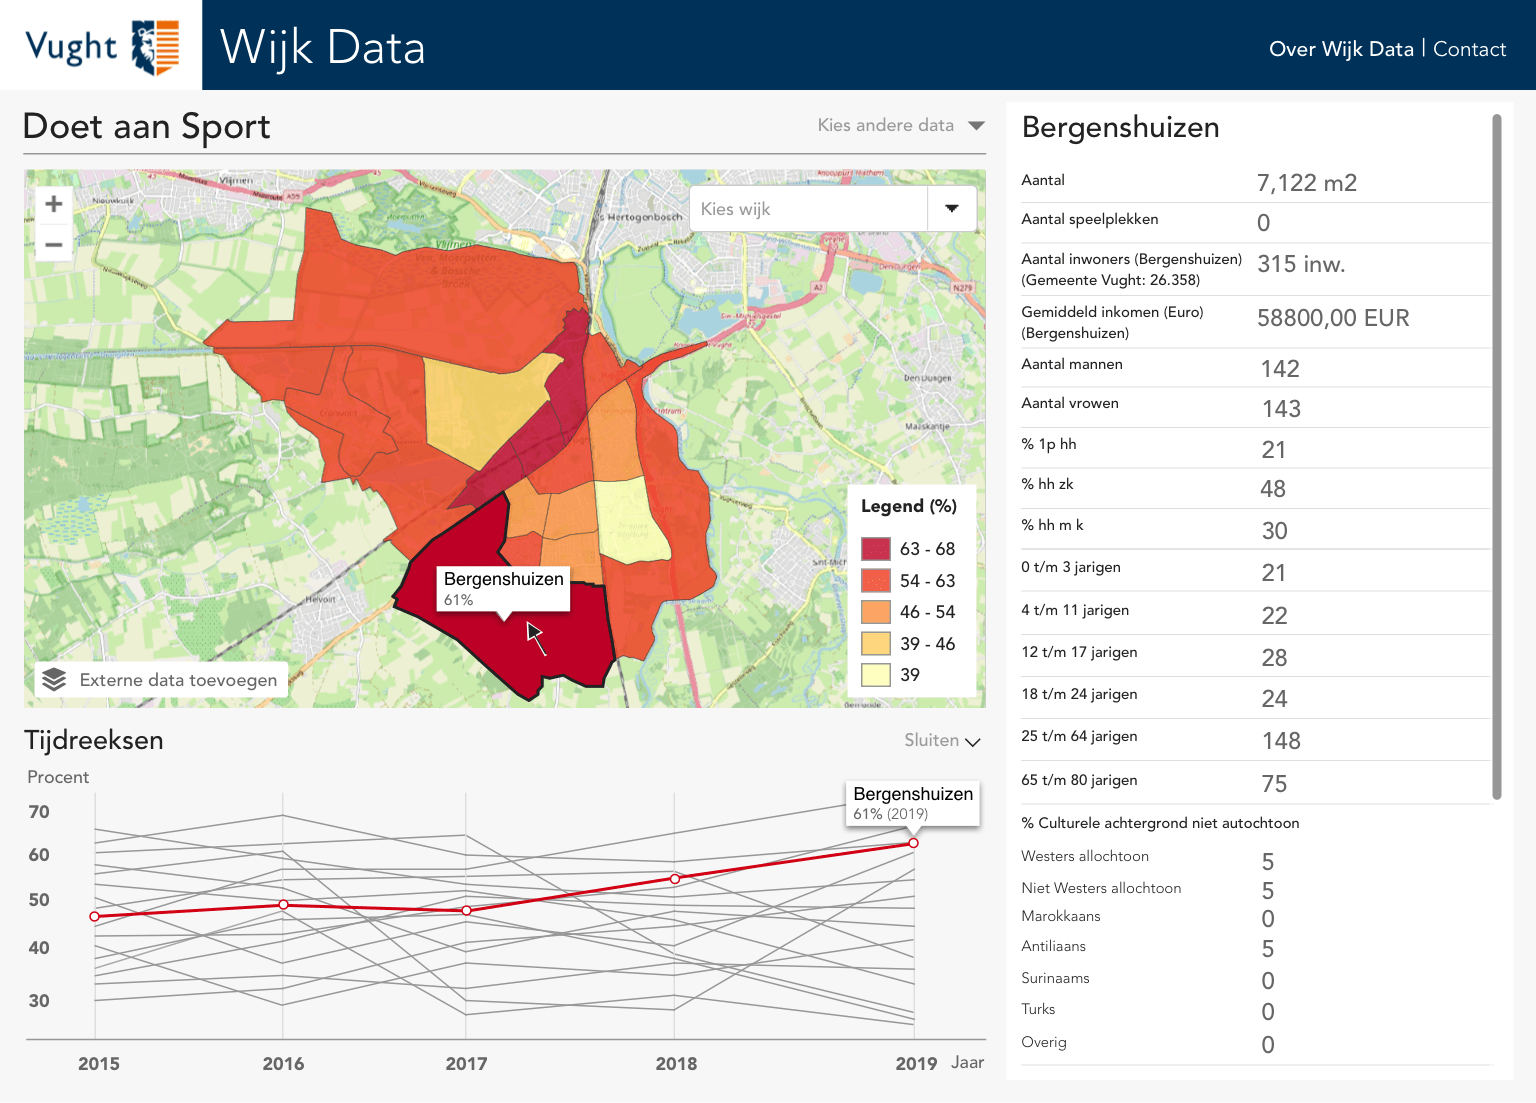
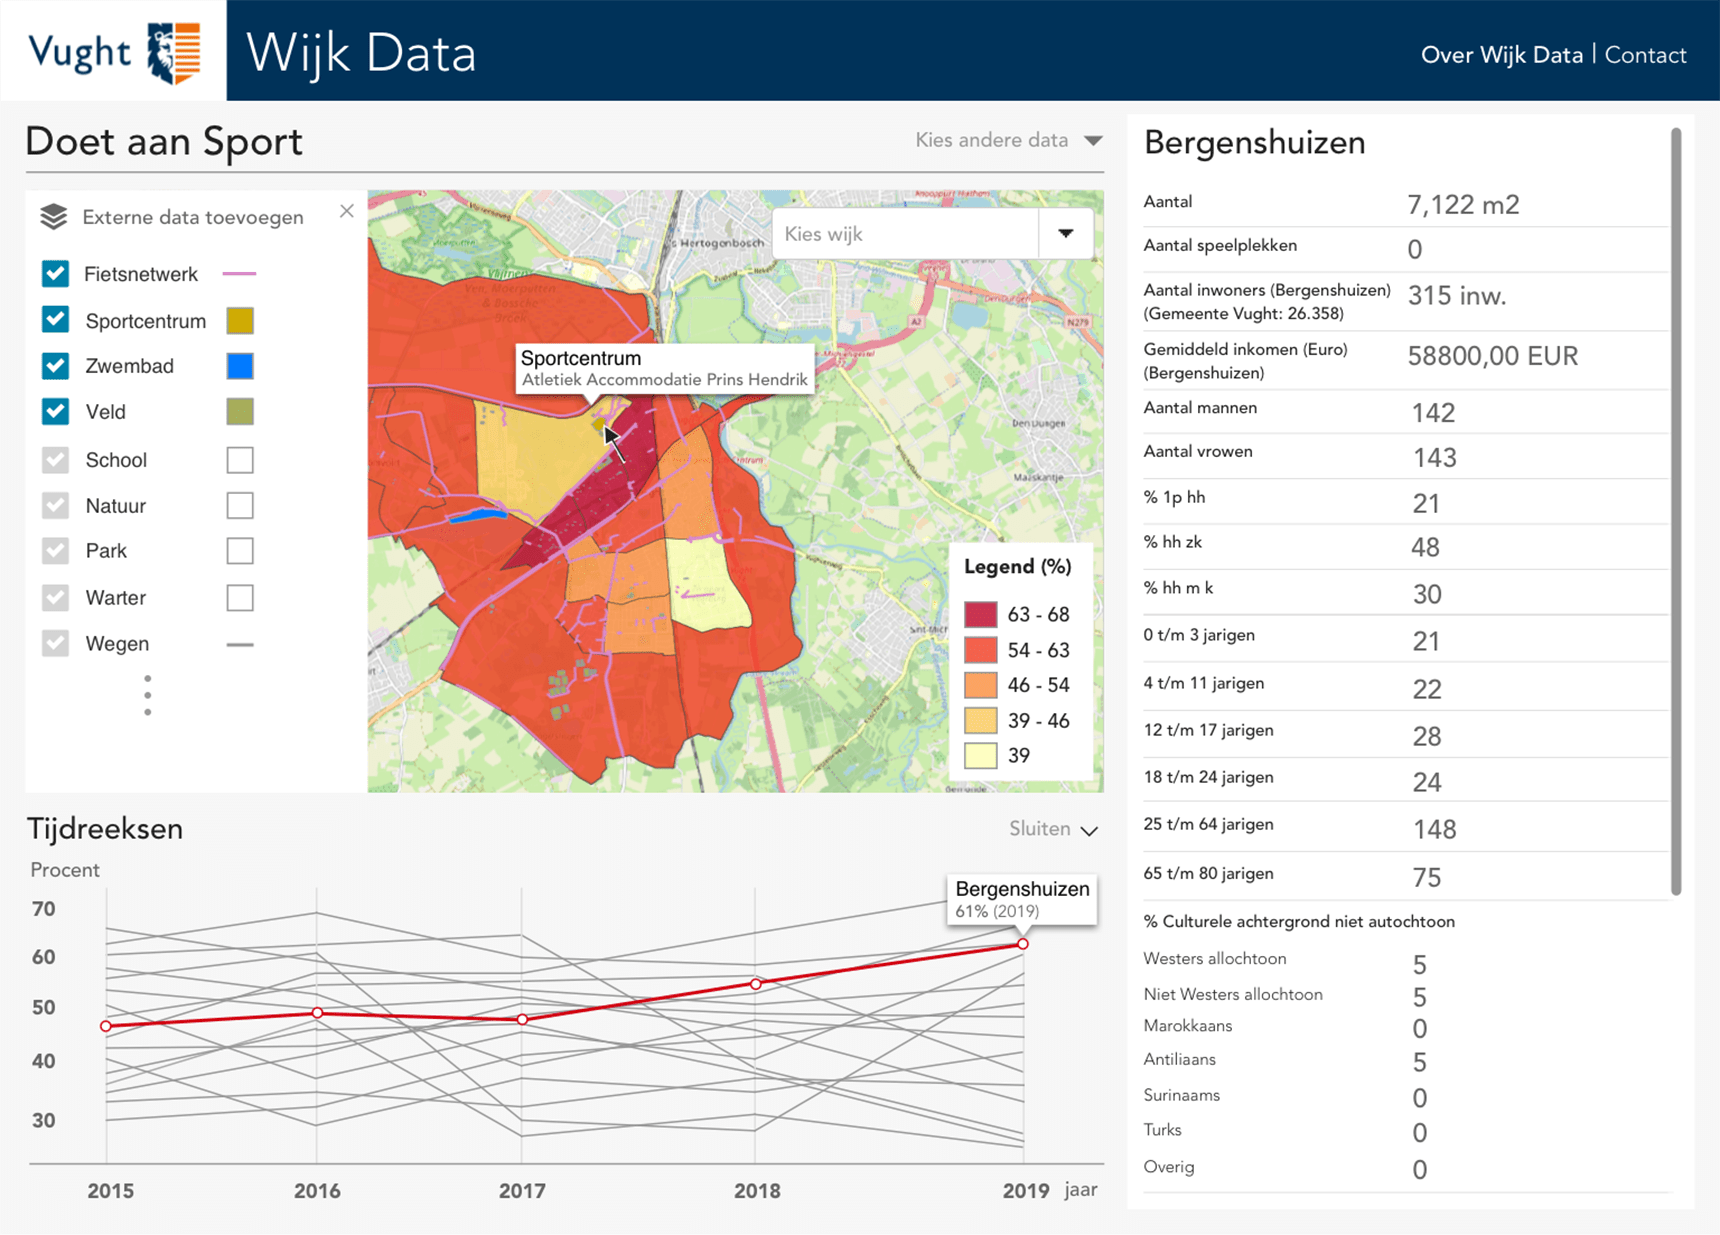

Vught Data Dashboard
This proposed dashboard design shows demographic data for the city of Vught (NL). I used a prototyping app, Sketch, to design the prototype.
Illustrator · Sketch · ArcGIS · QGIS · R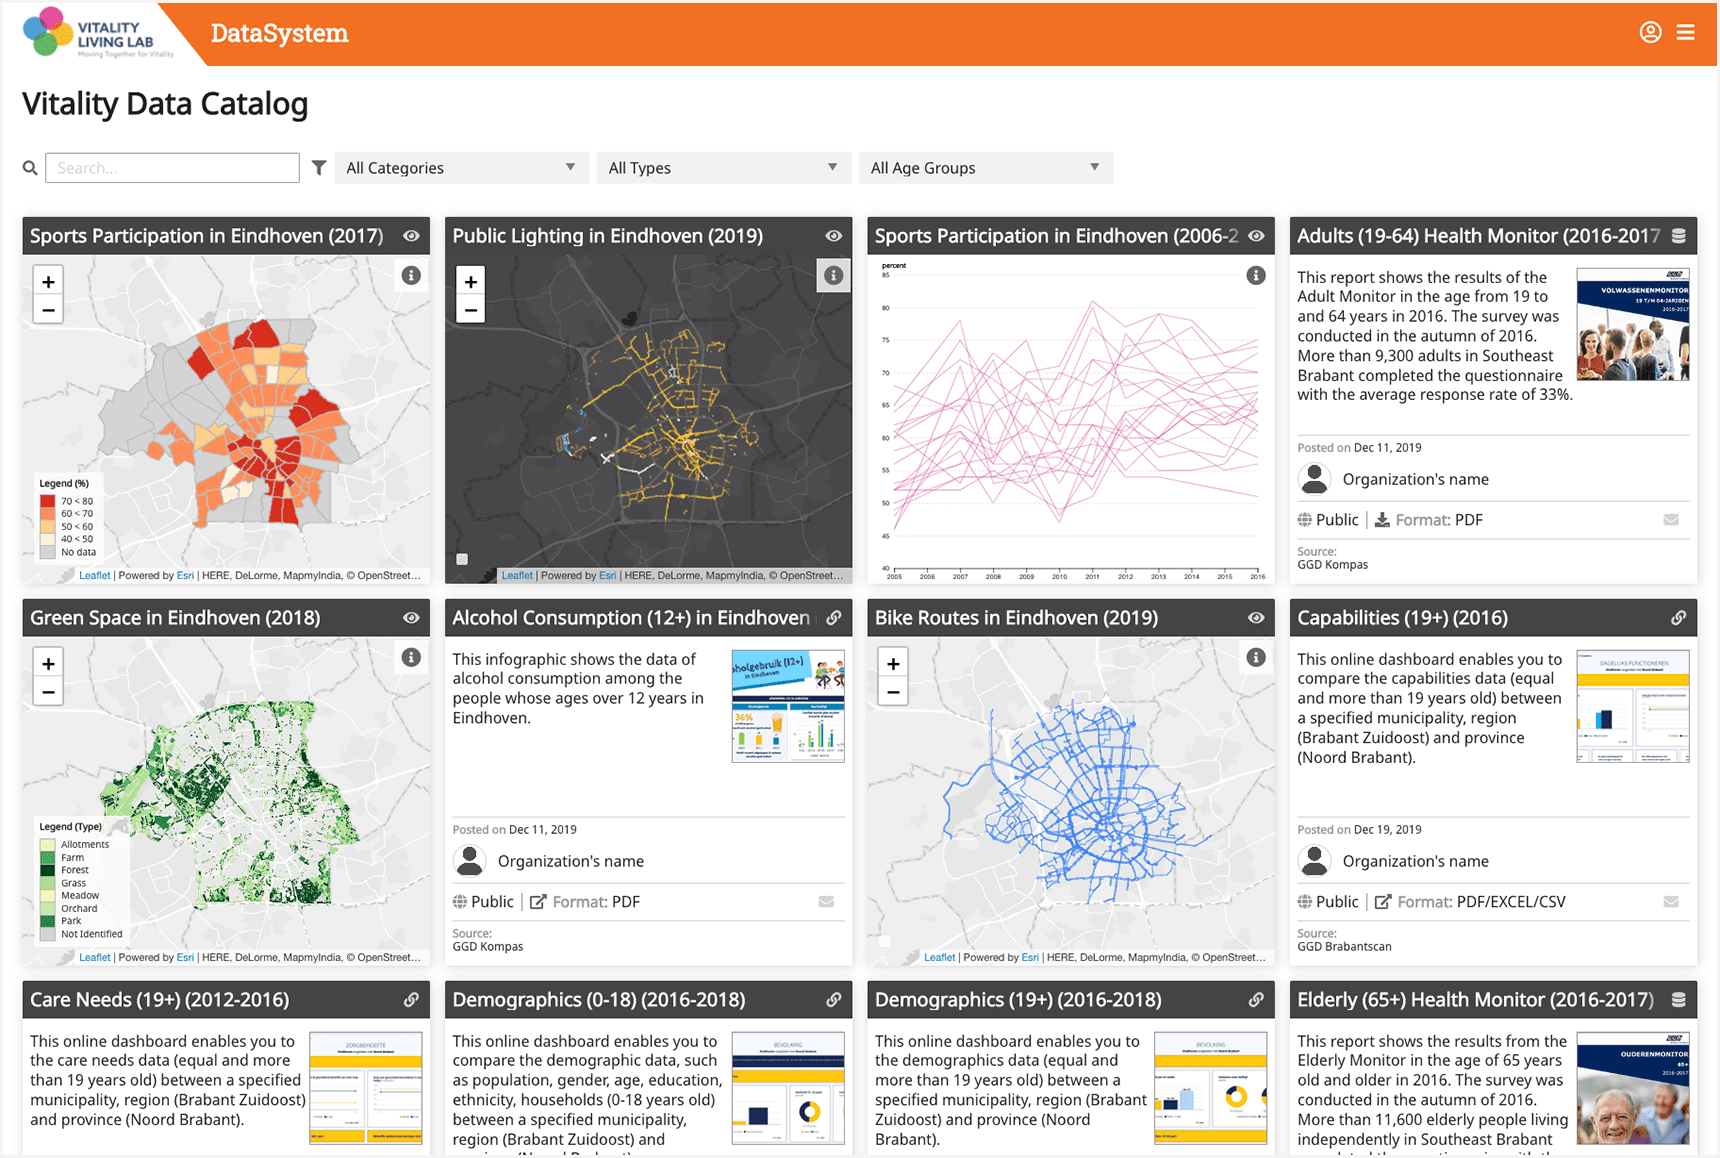
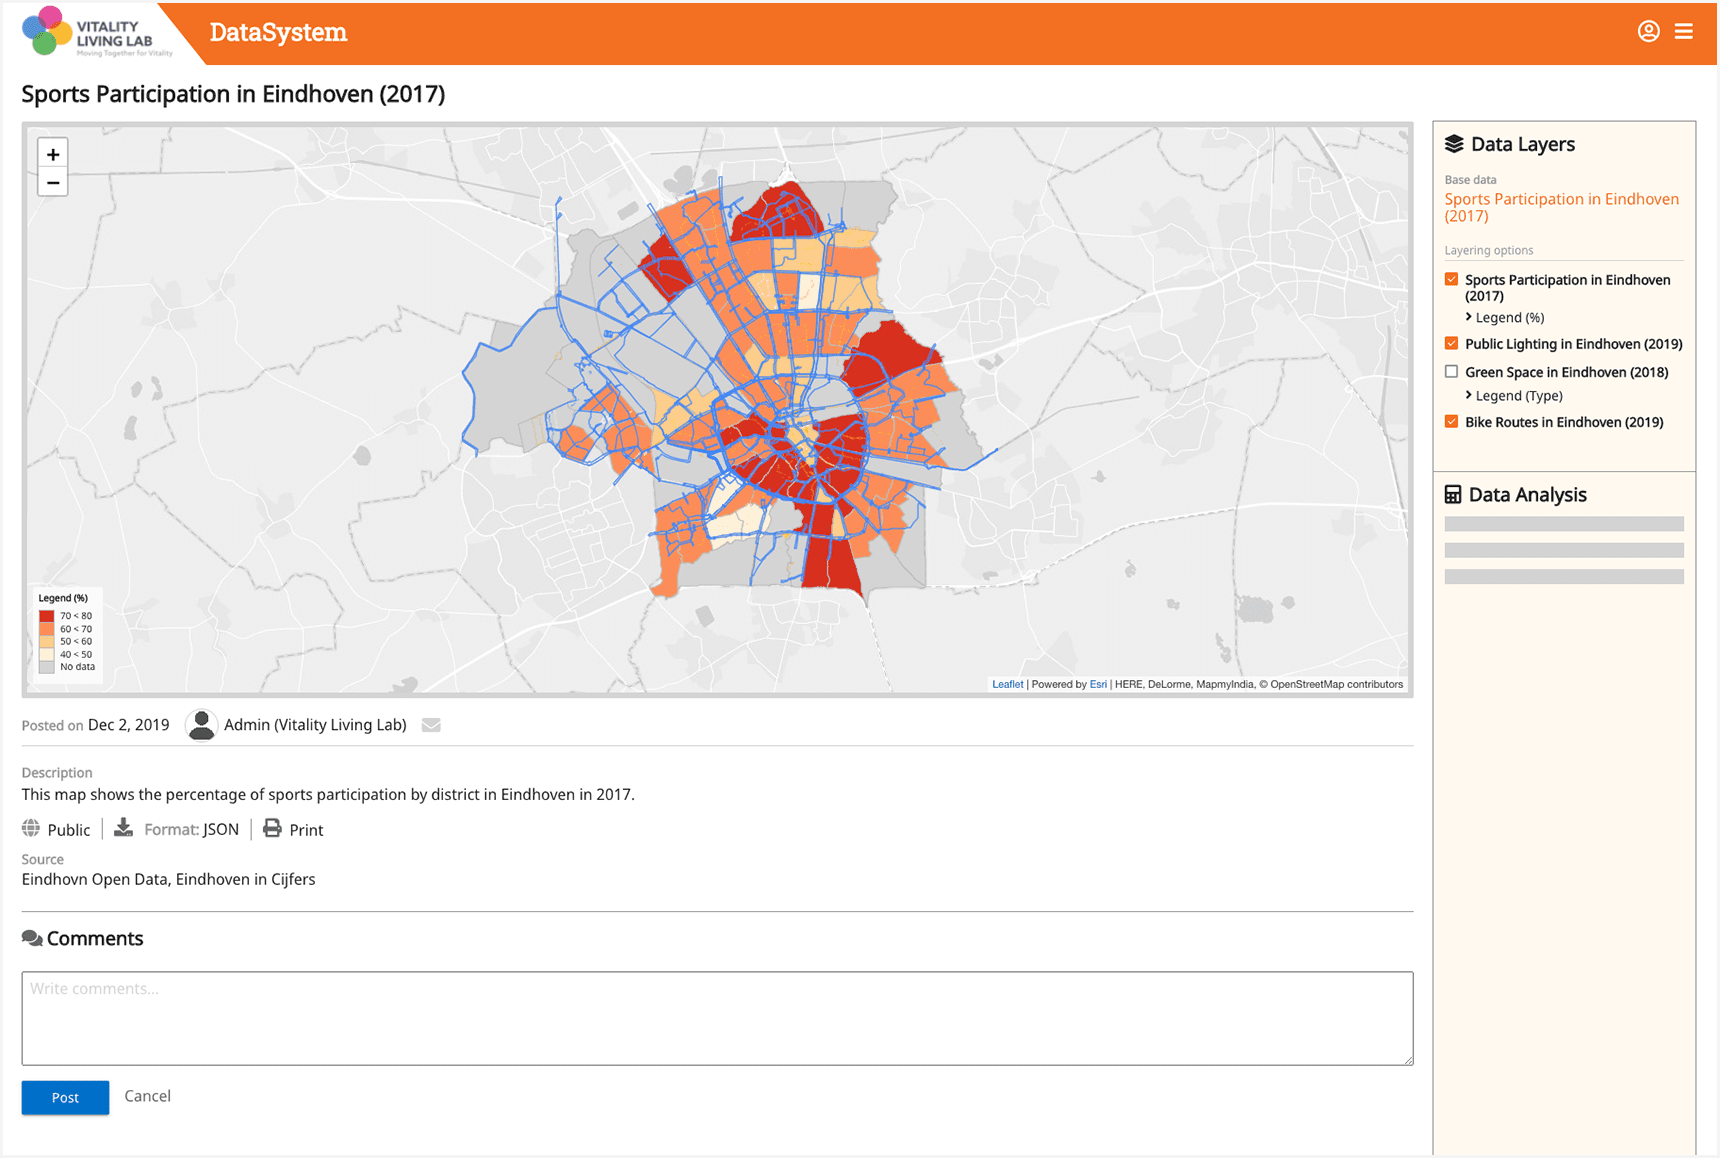
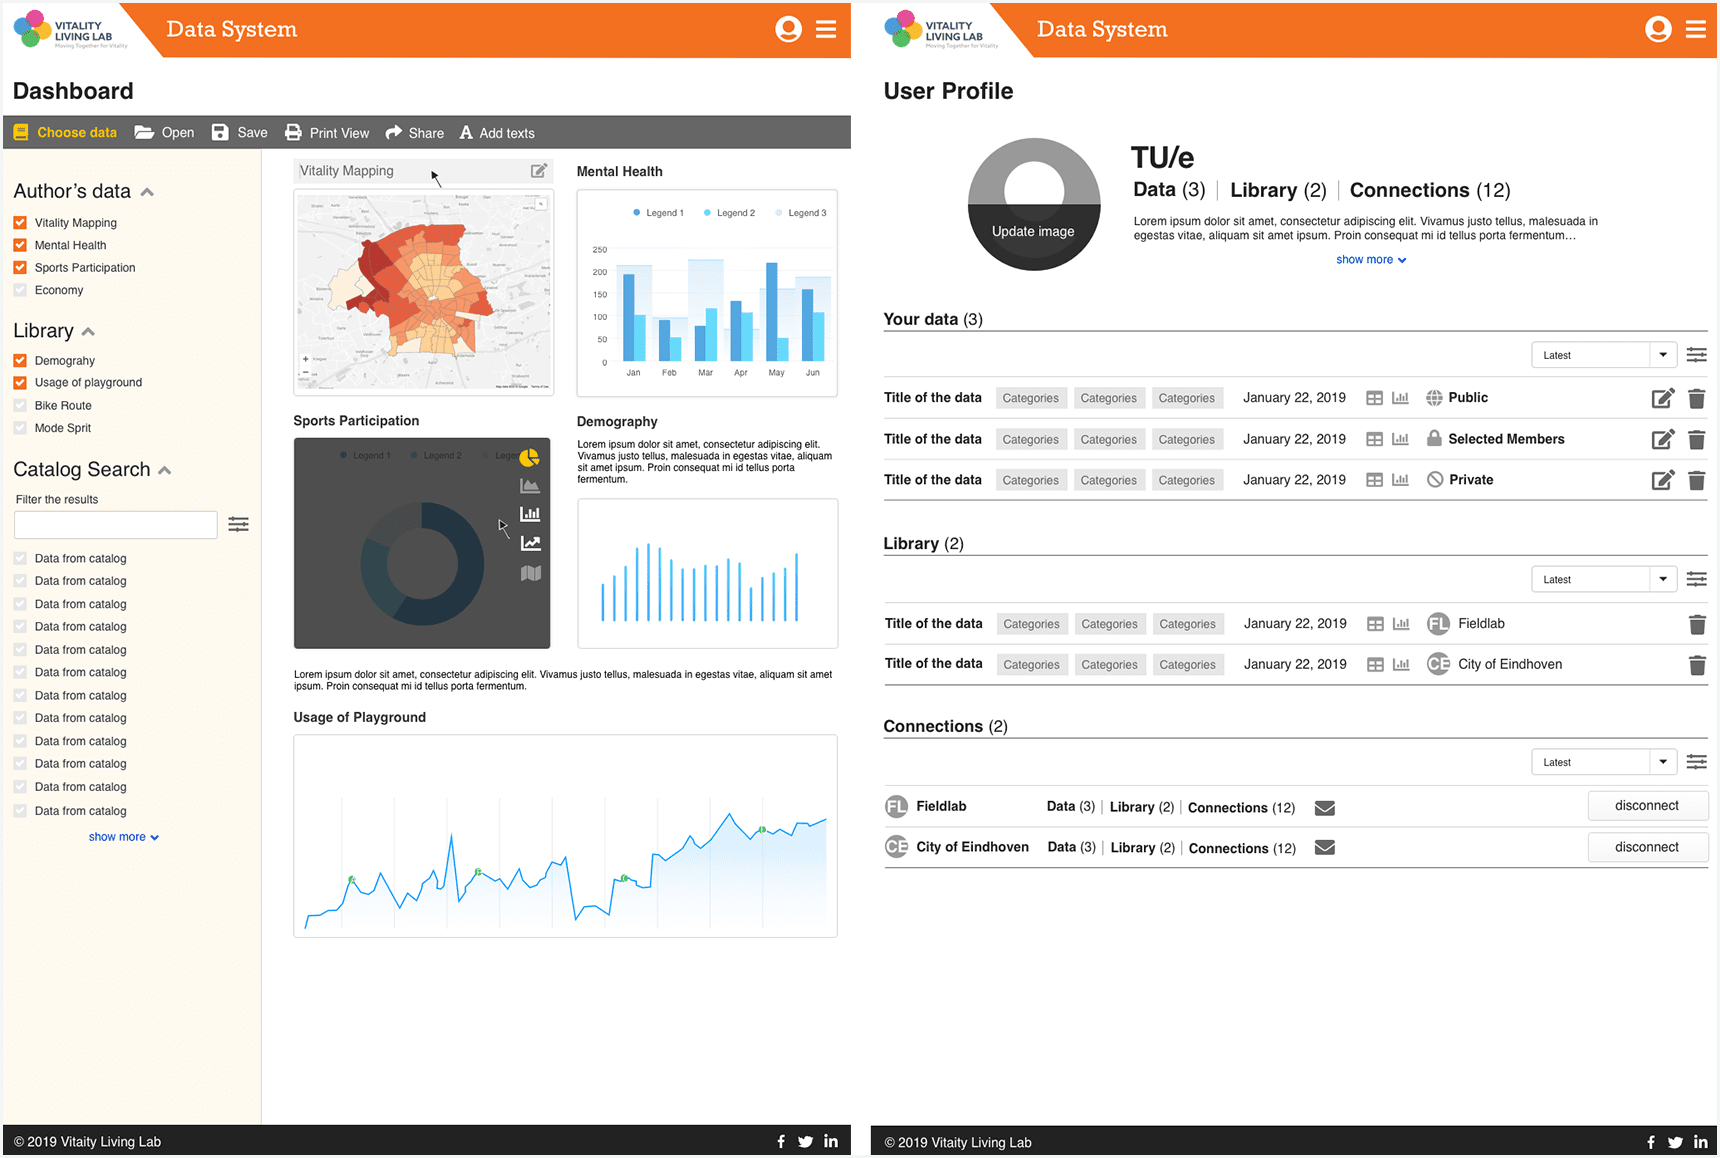
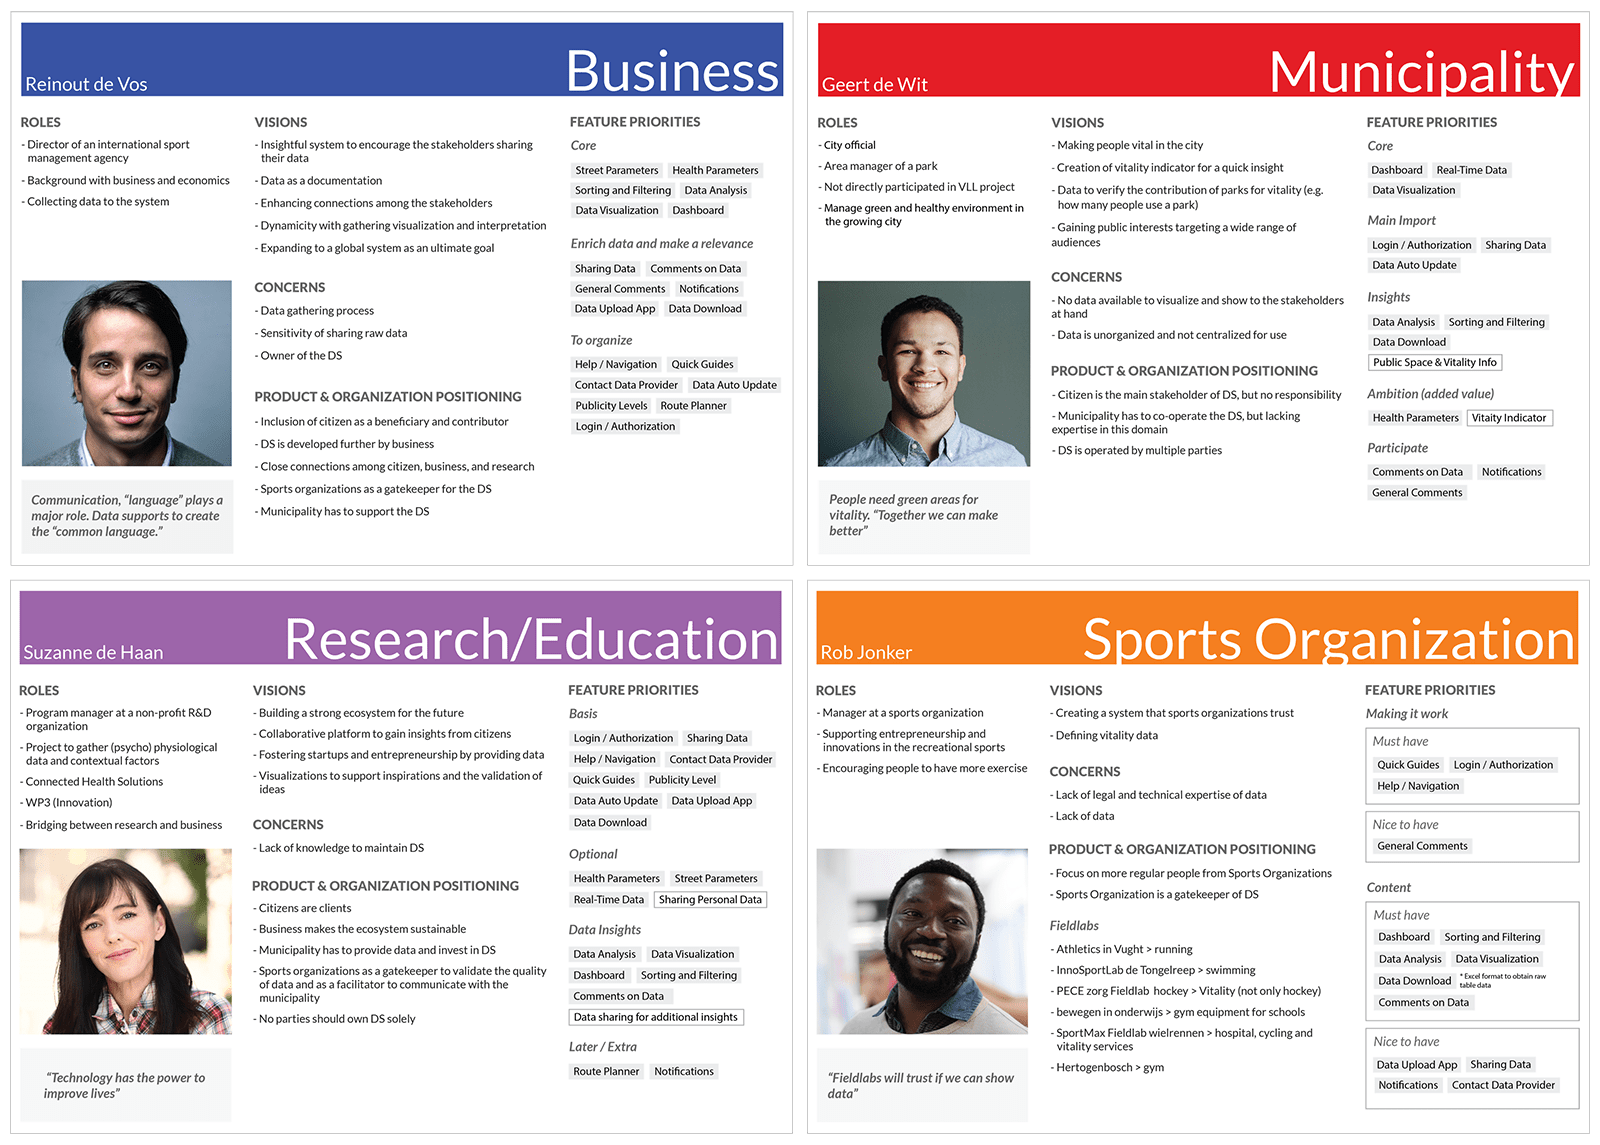
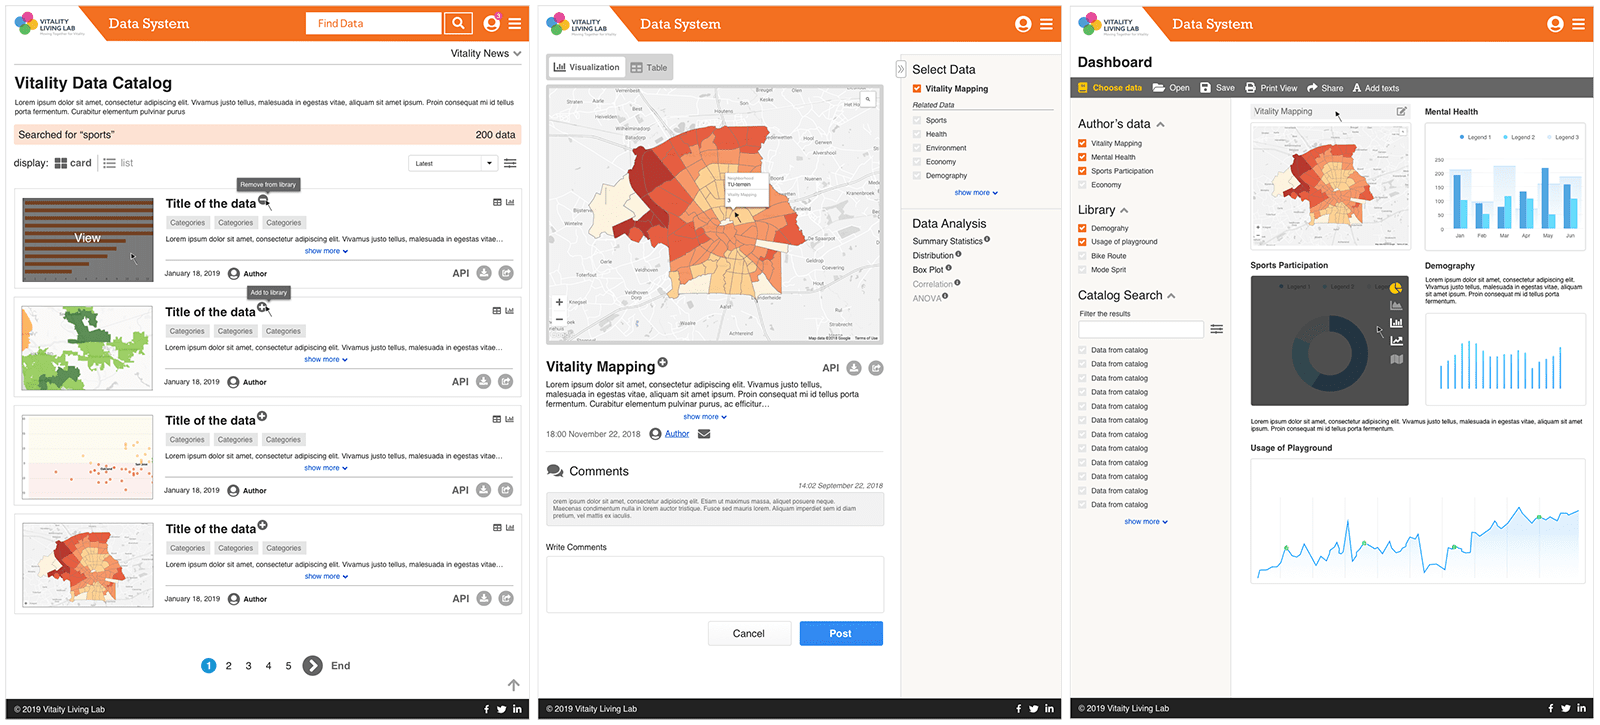
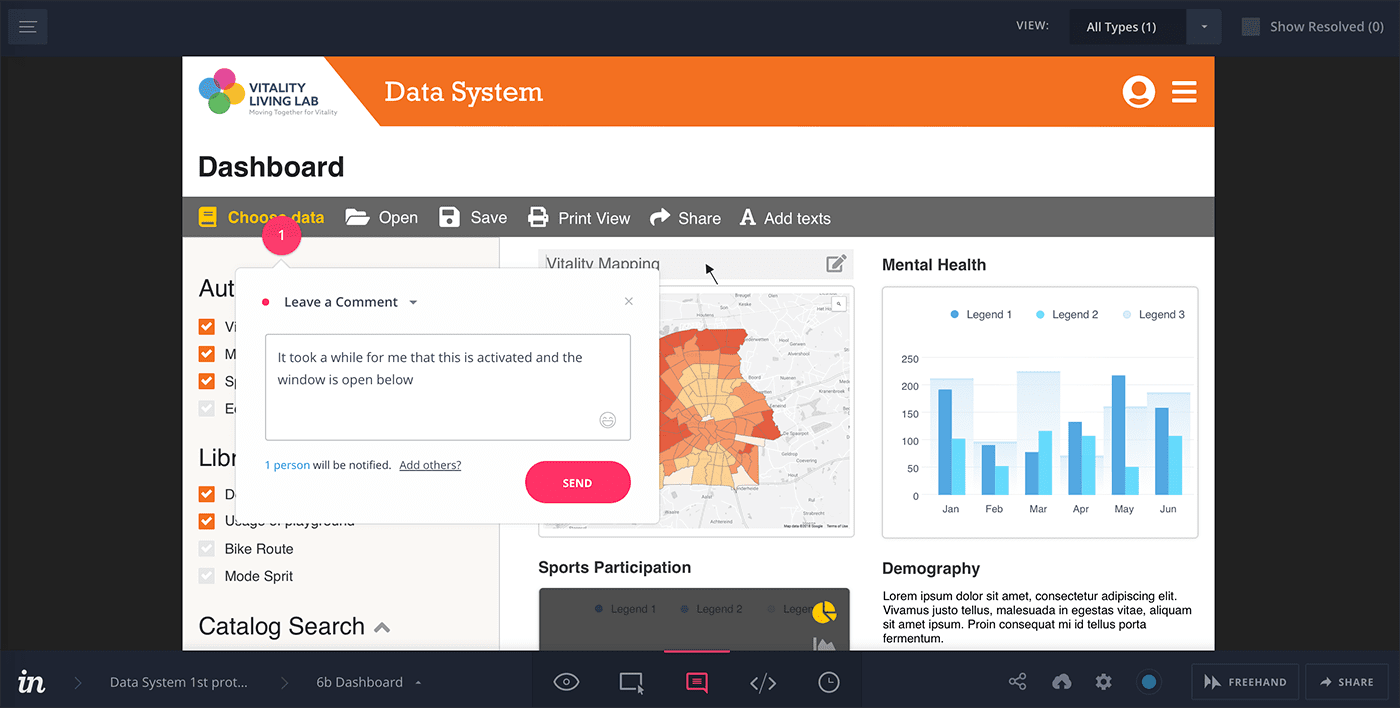
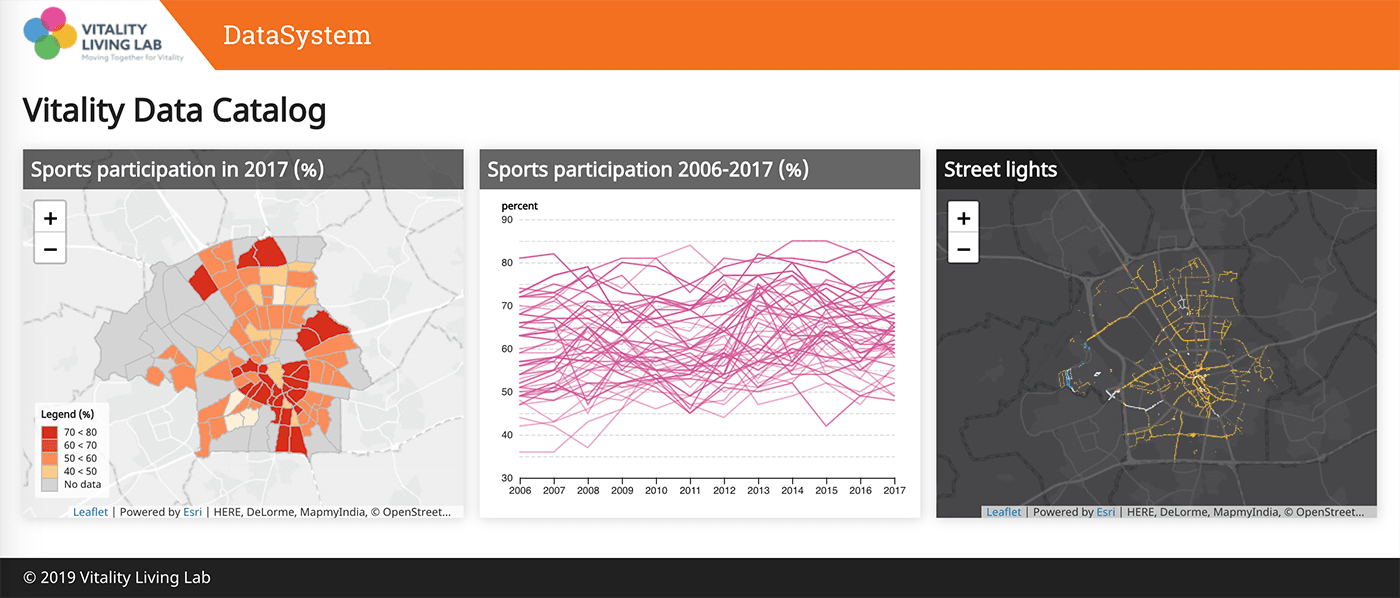
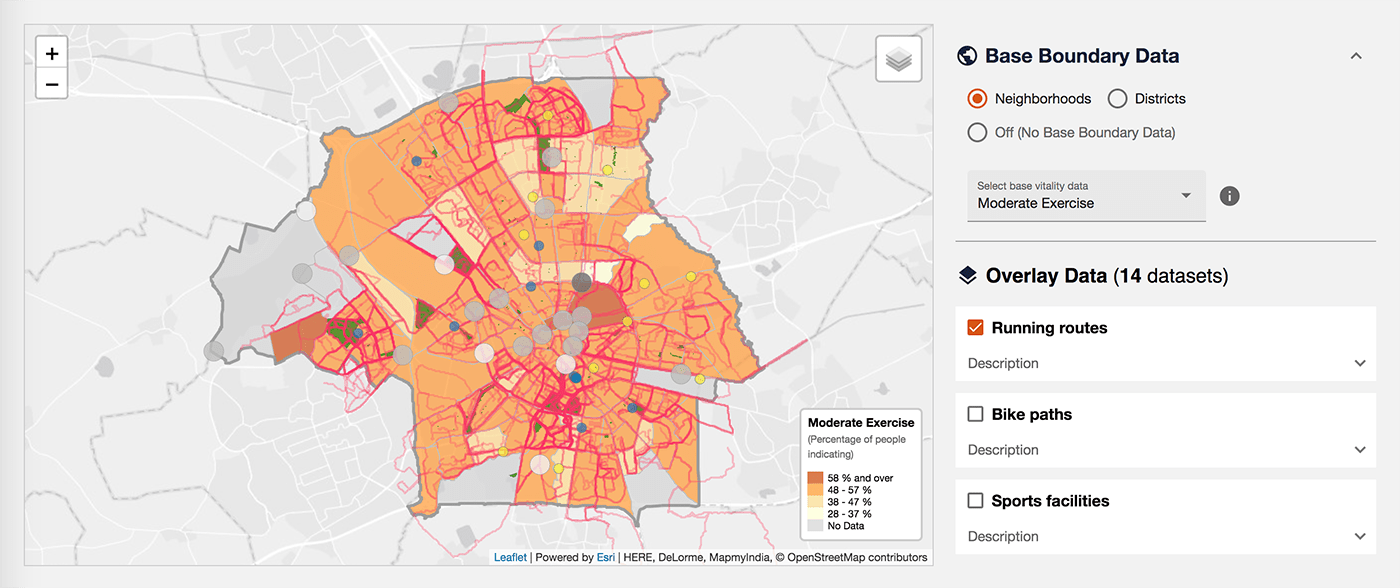
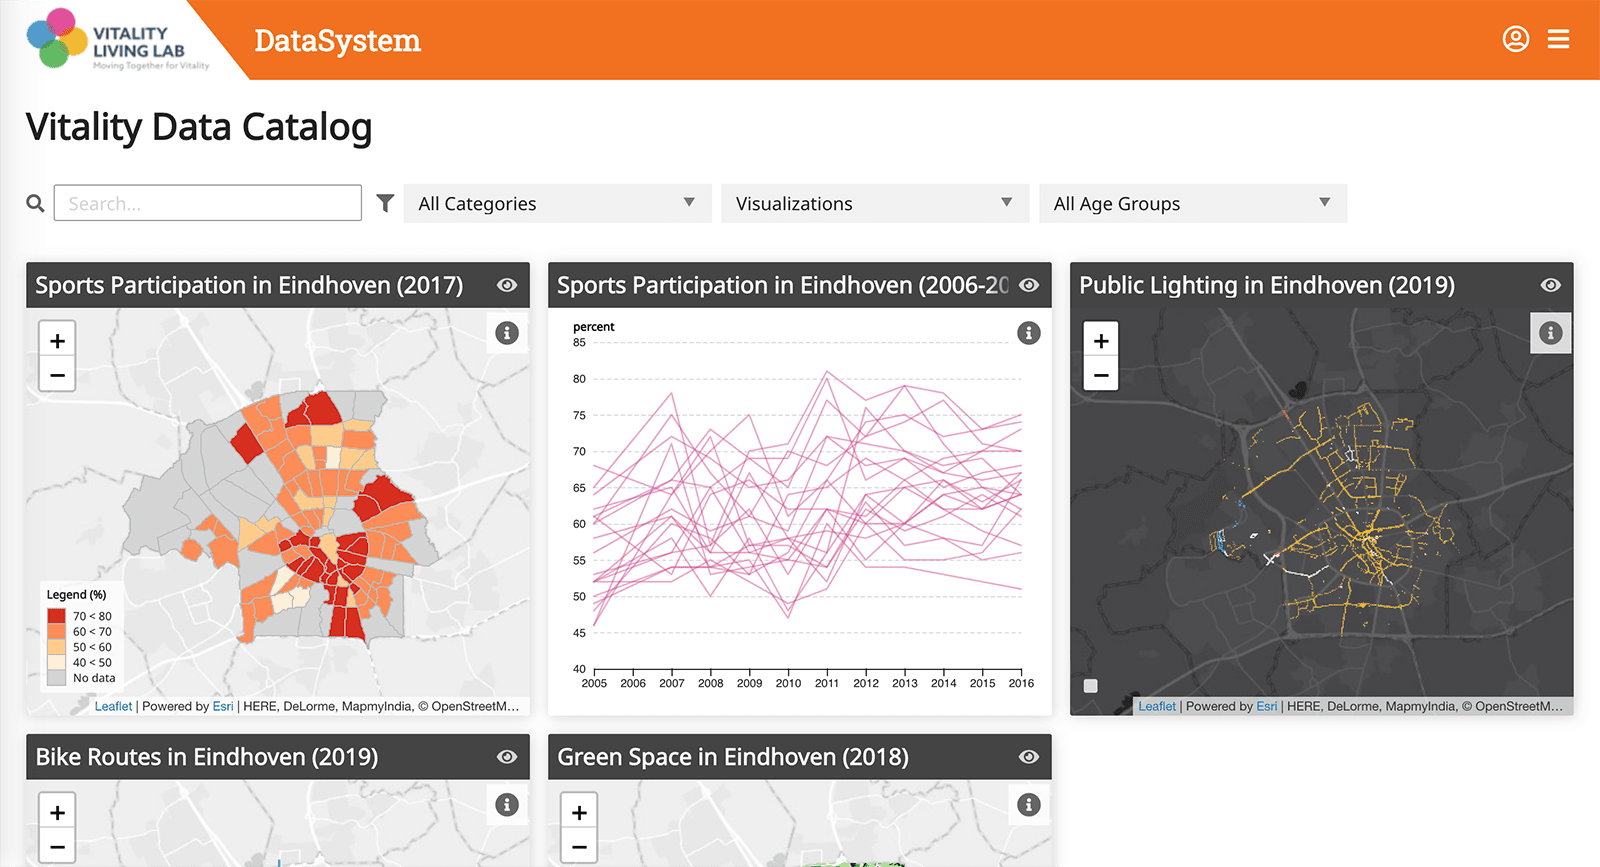
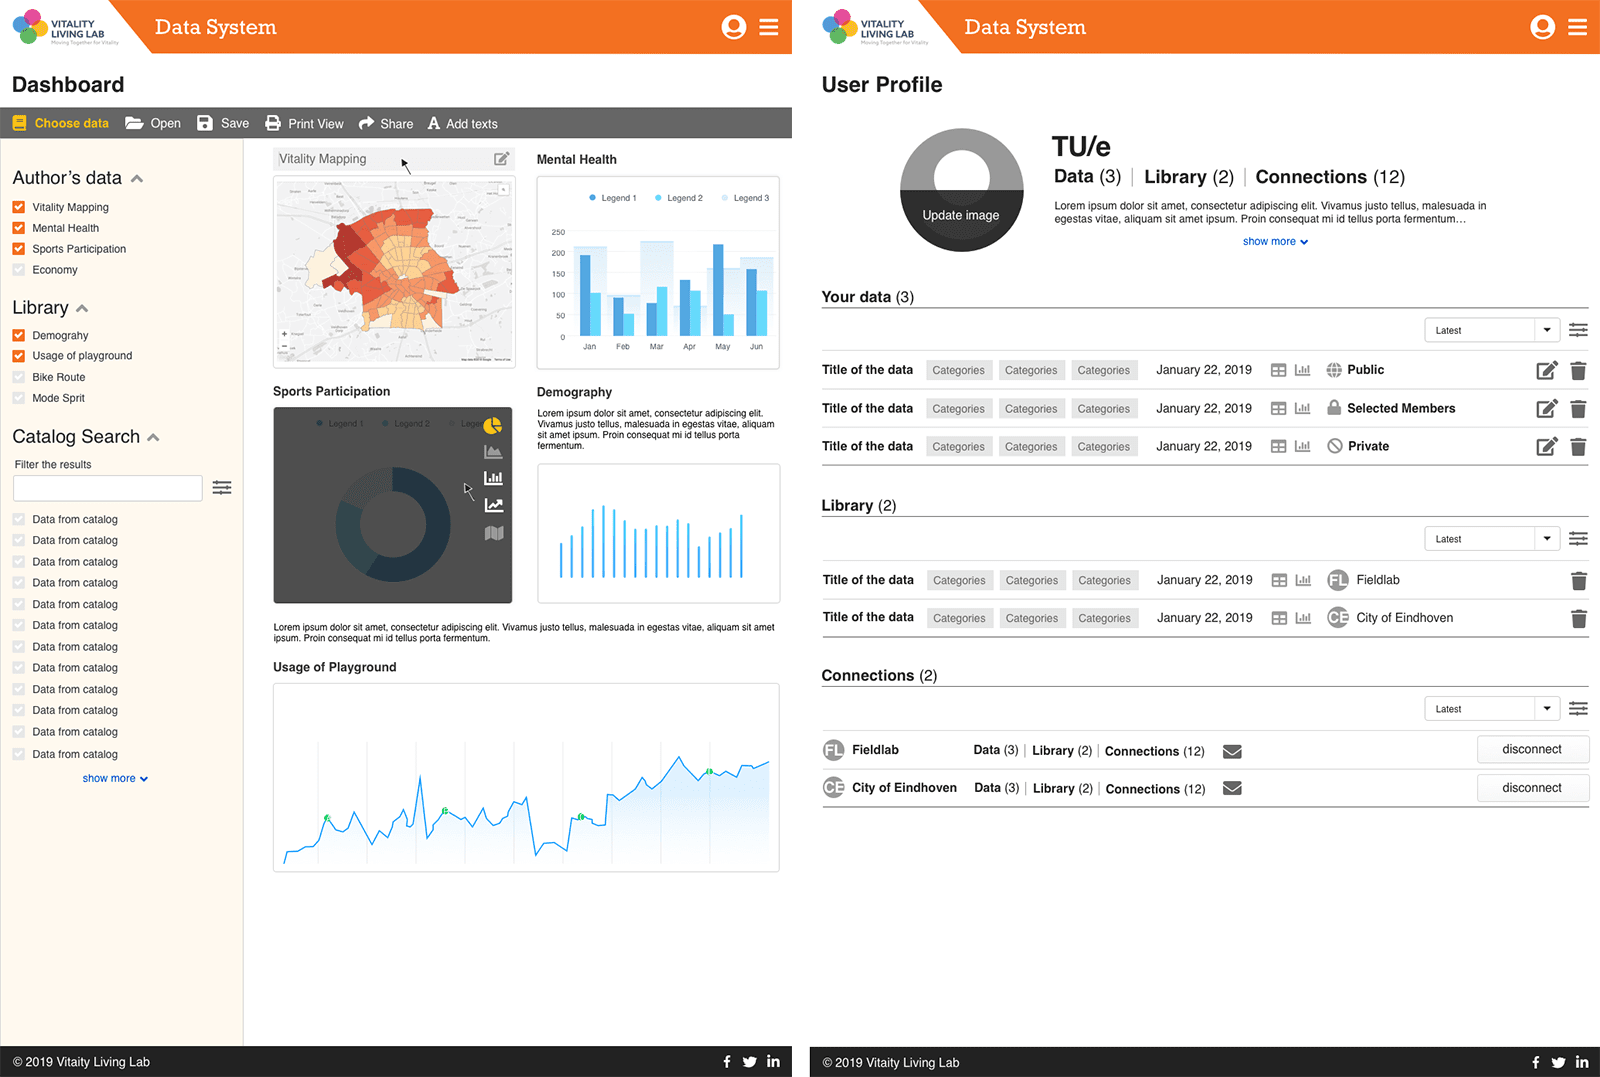
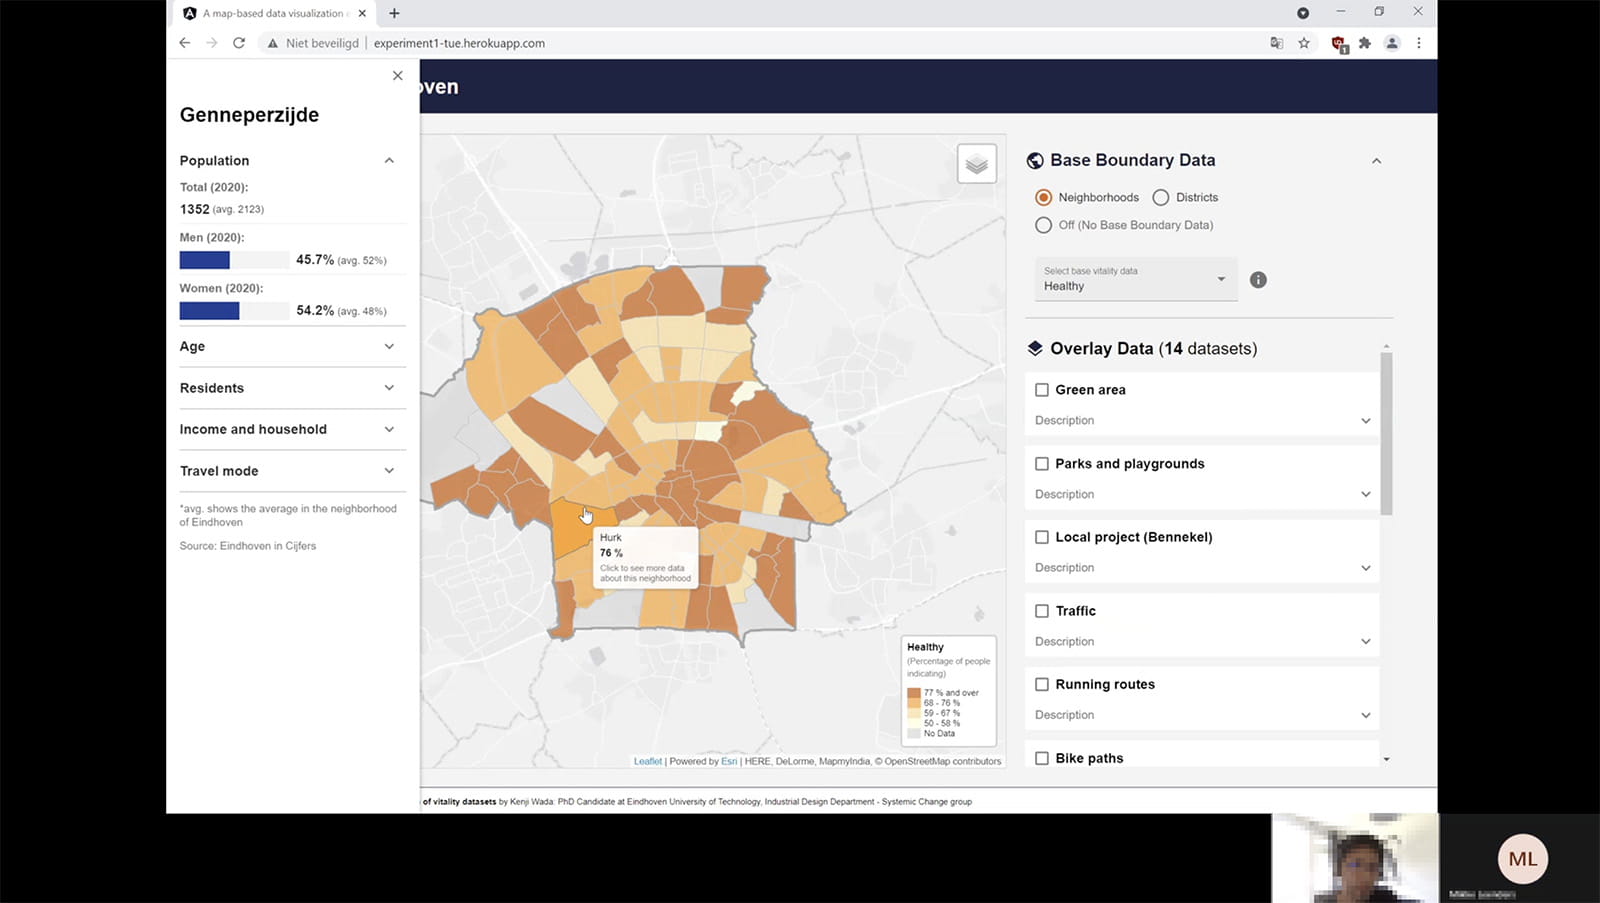
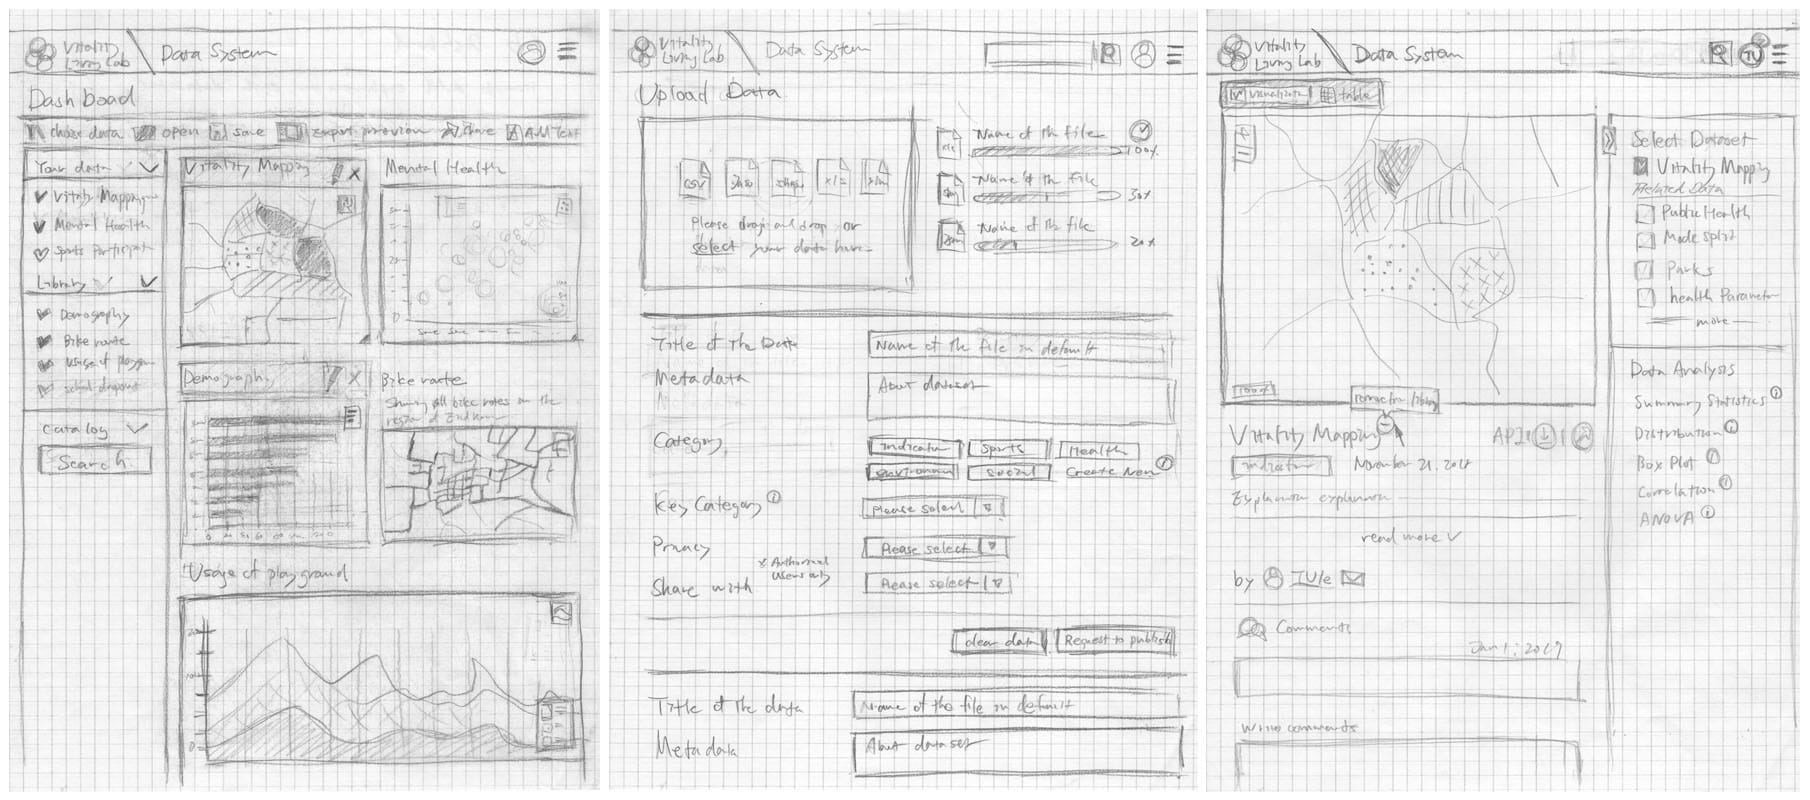
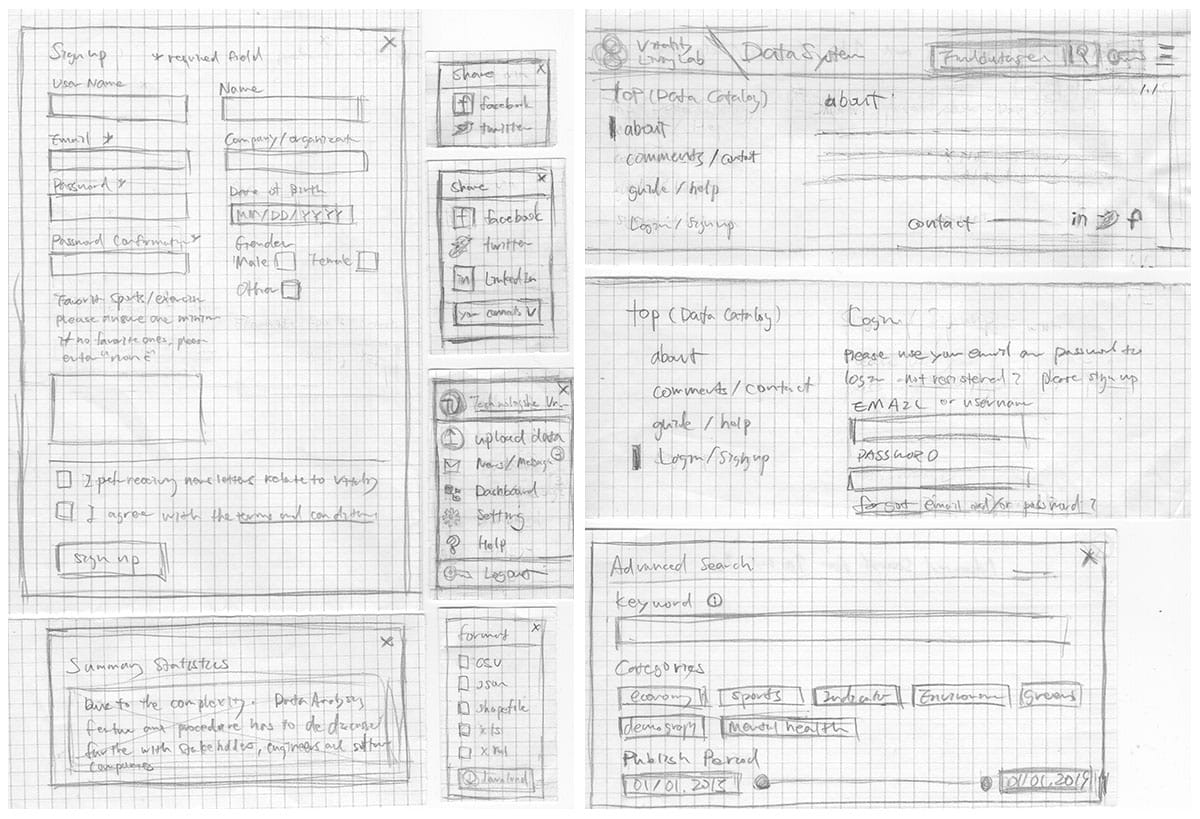
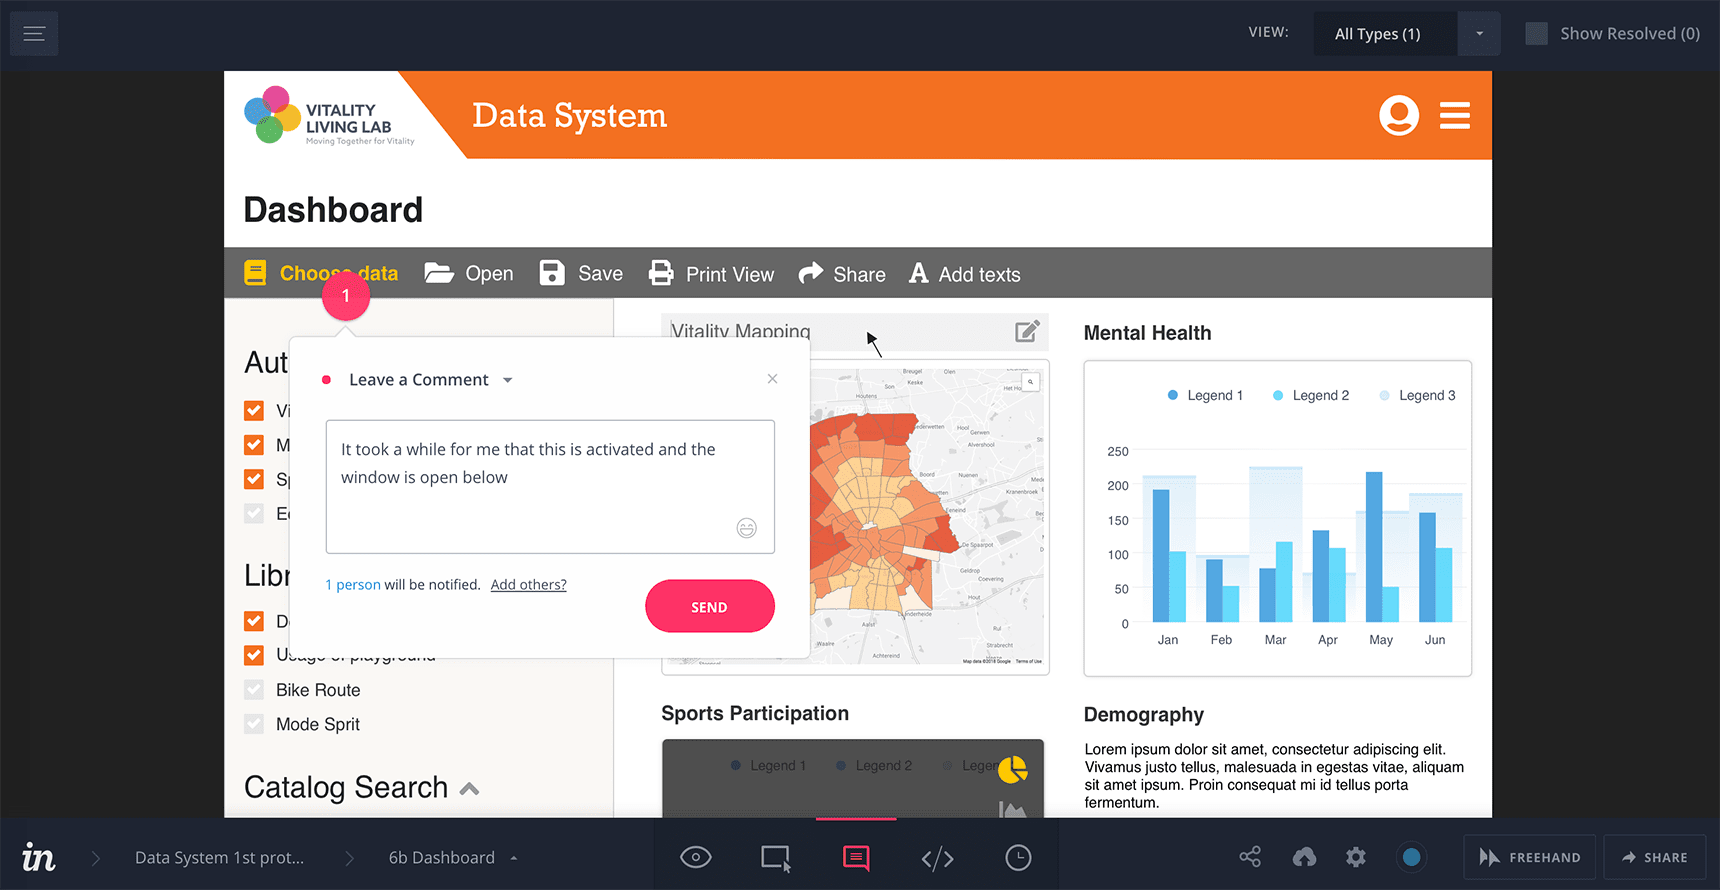
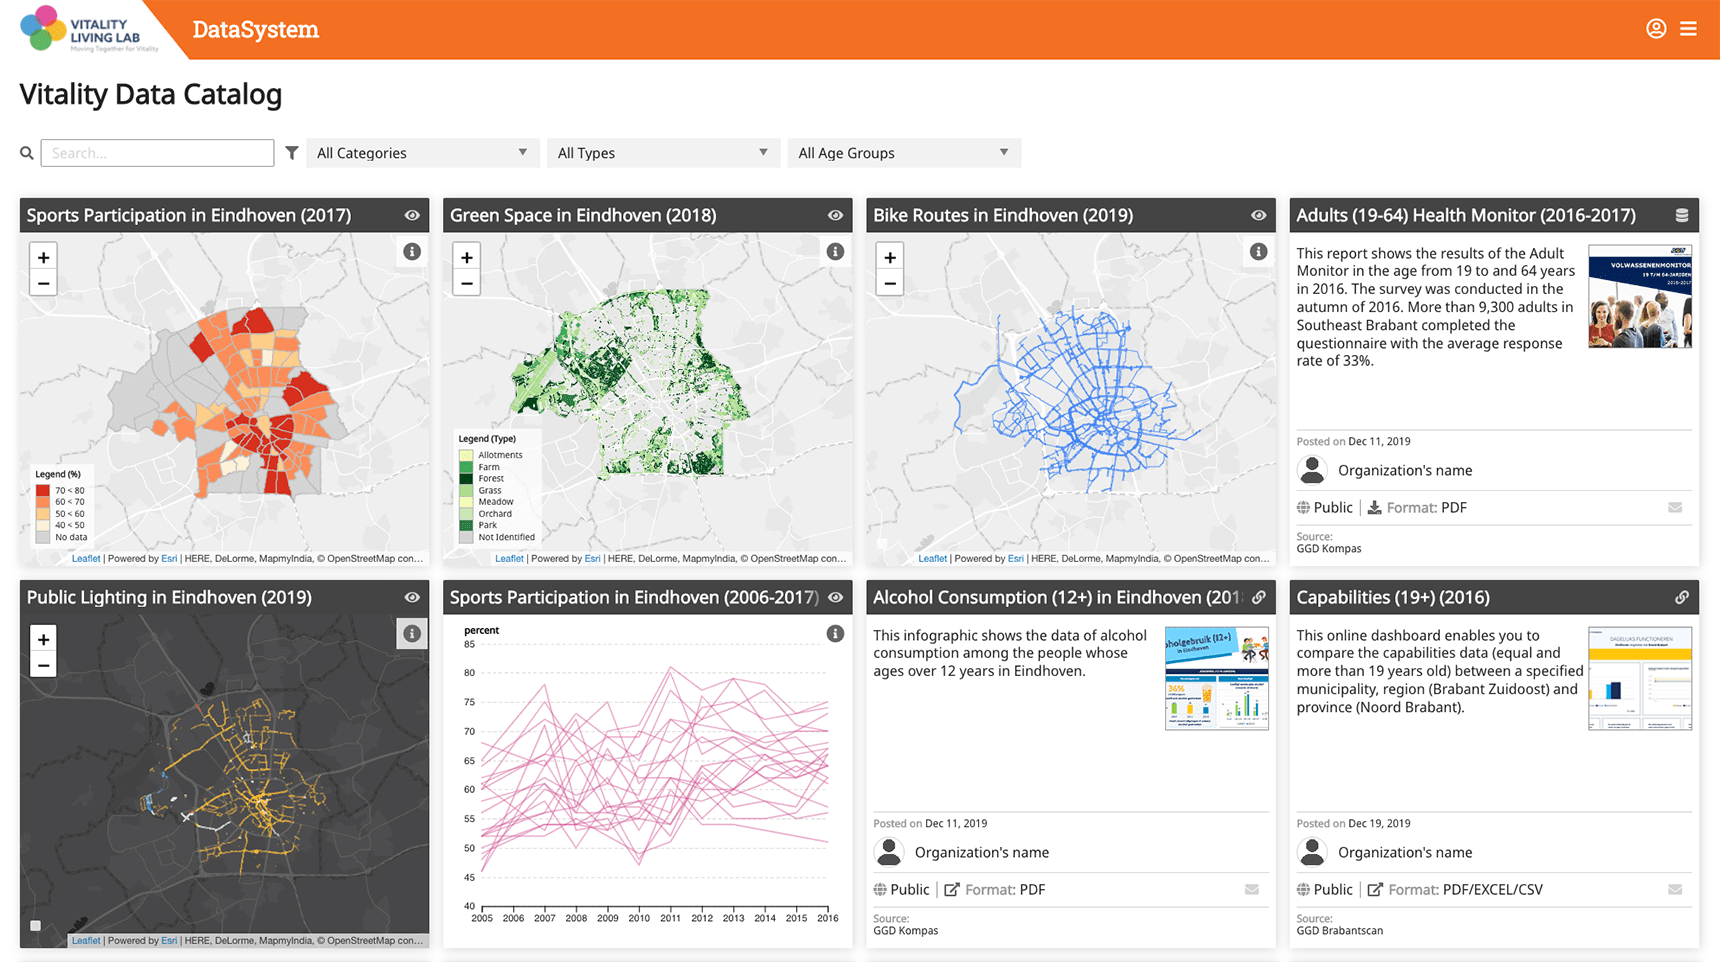
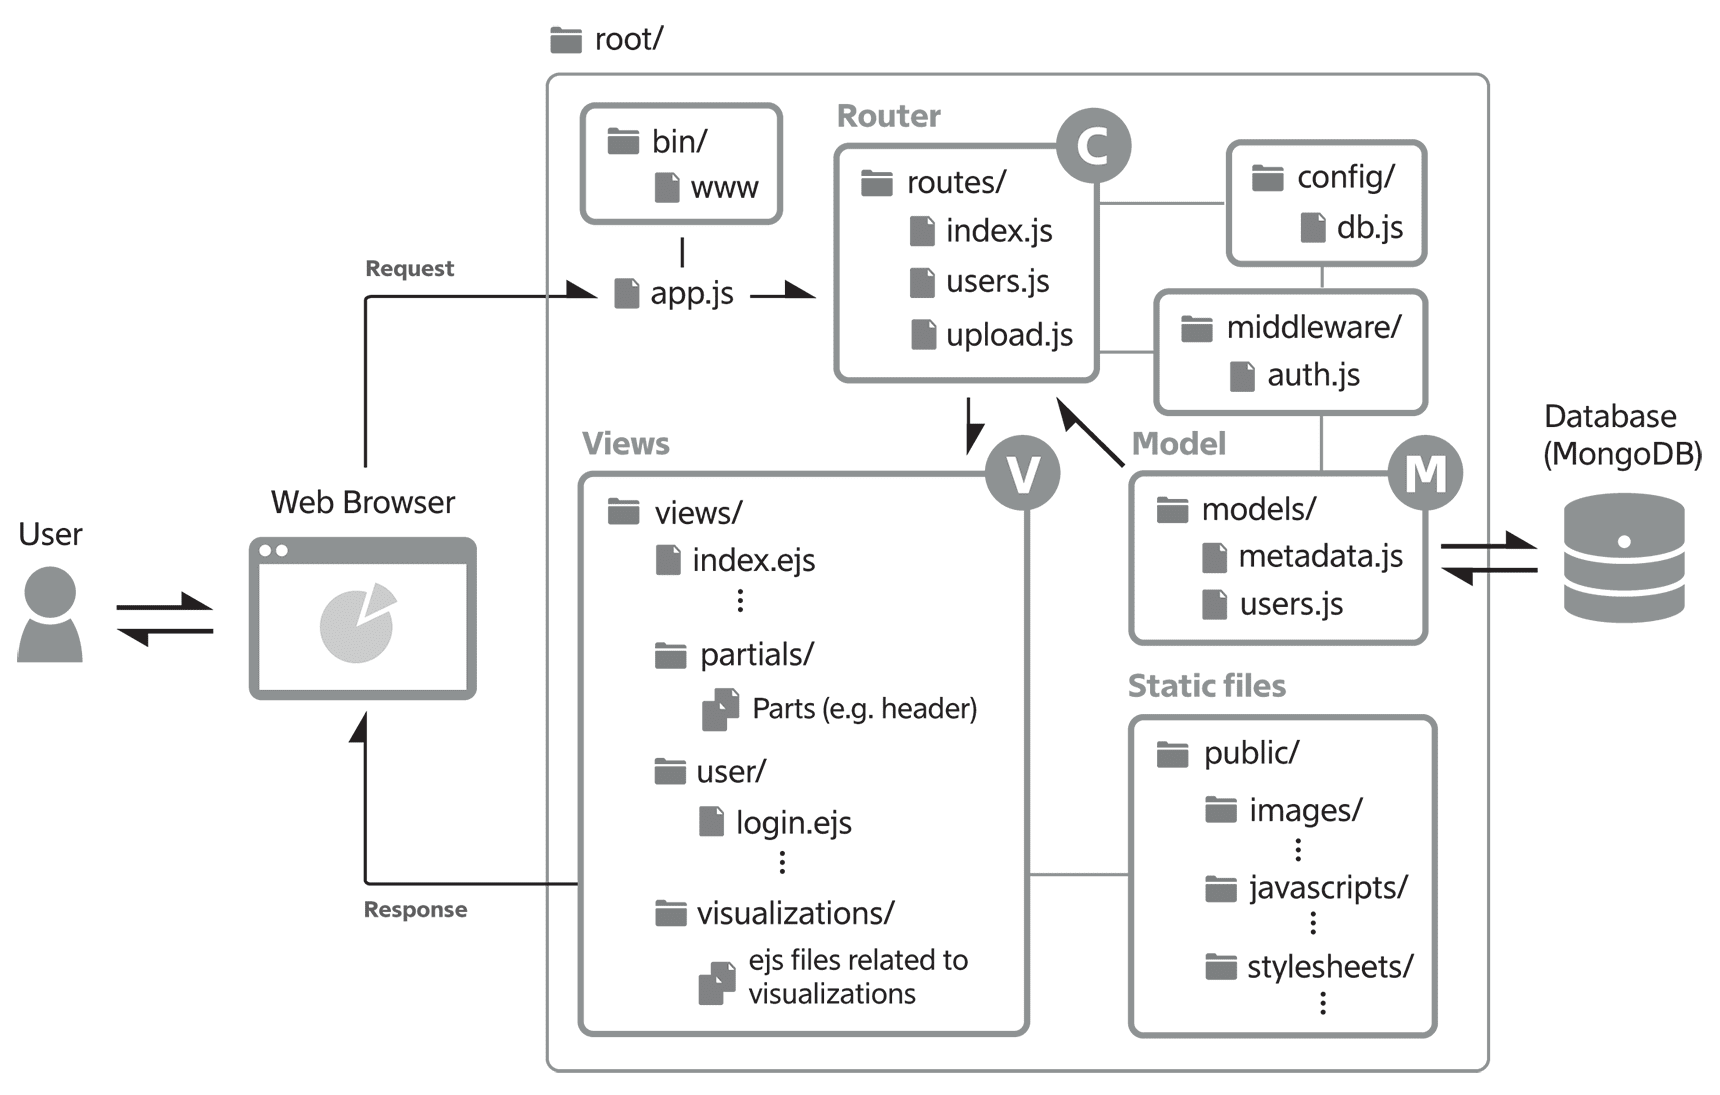
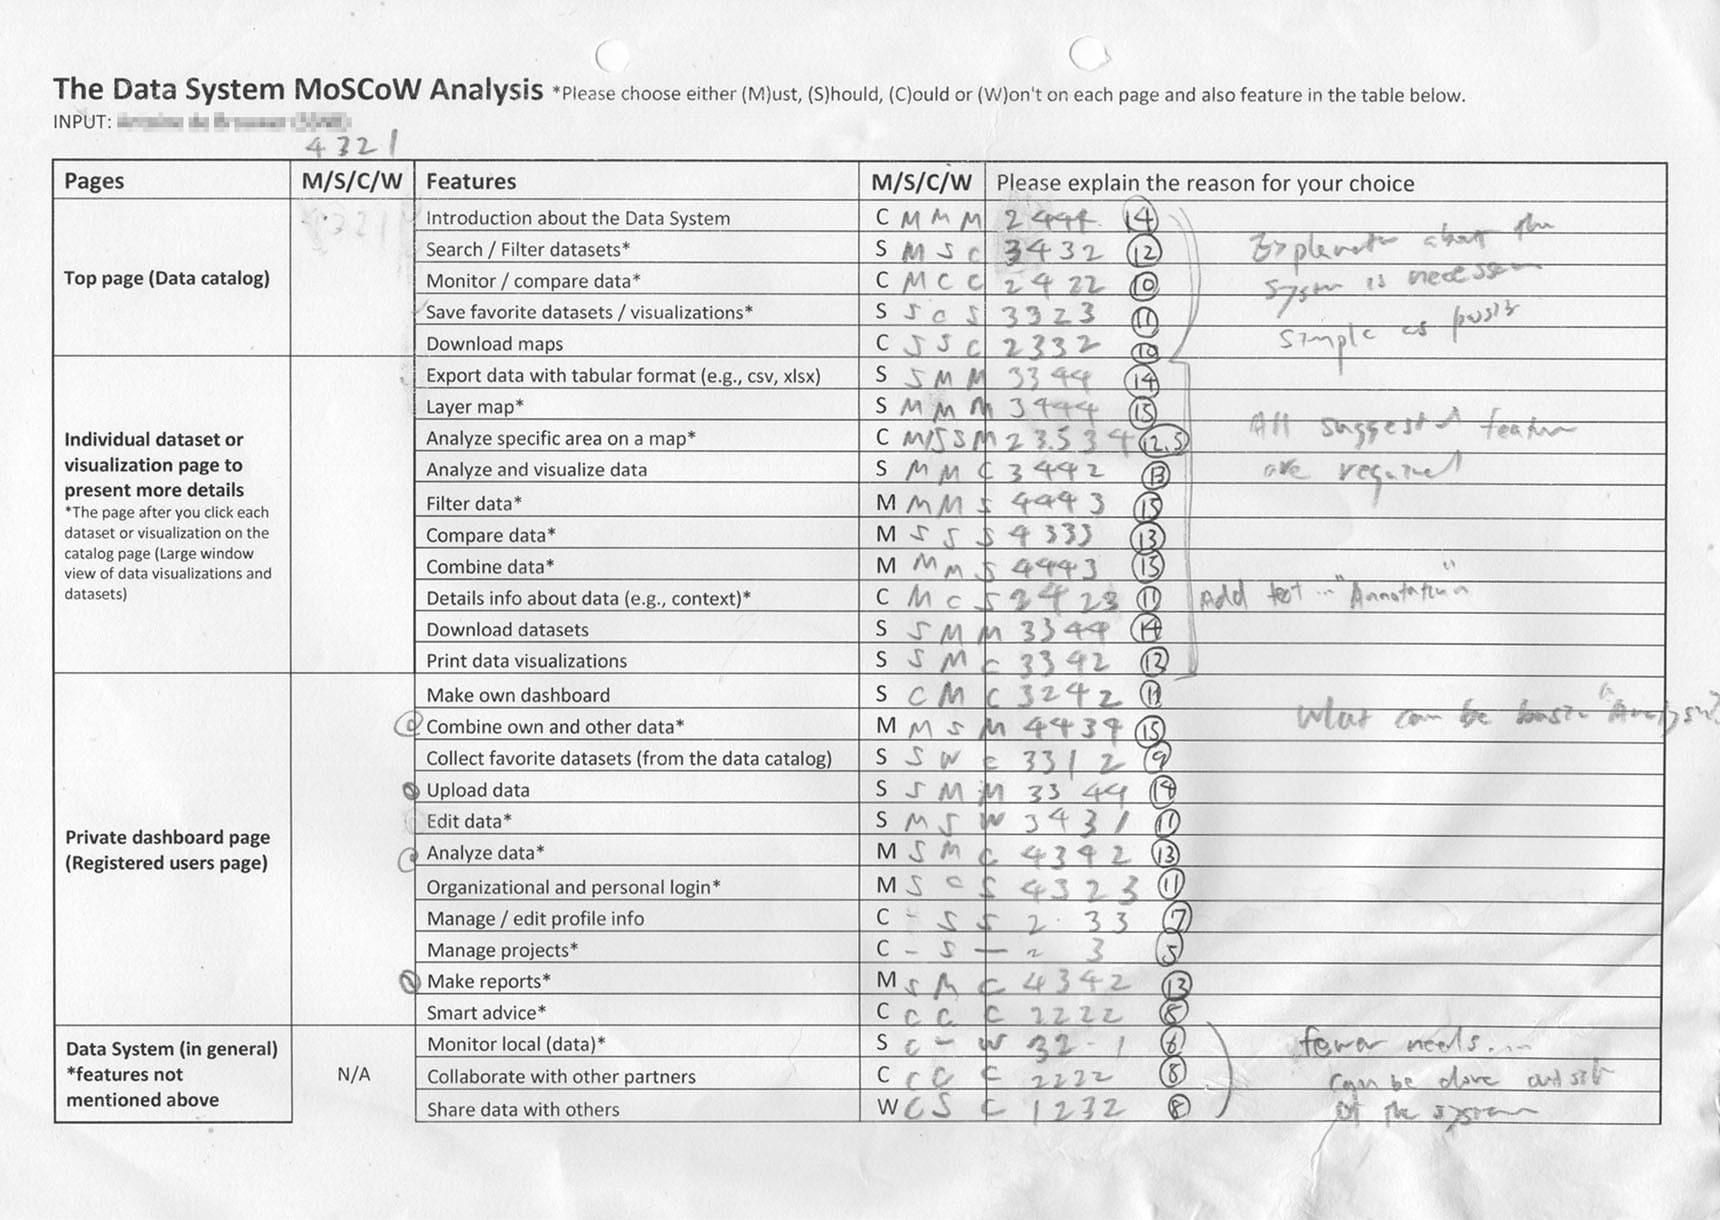
Data System for VLL
Data curation application related to vitality designed for the VLL (Vitality Living Lab) project. The top page shows all publicly available datasets. Authentication functions are developed based on Node.js and MongoDB (database). Individual dataset pages provide more tools such as overlaying maps. Profile pages after logging in are not developed (digital prototypes).
HTML · CSS · JavaScript · D3 · Leaflet · ArcGIS · QGIS · R · Illustrator · Sketch · InVision
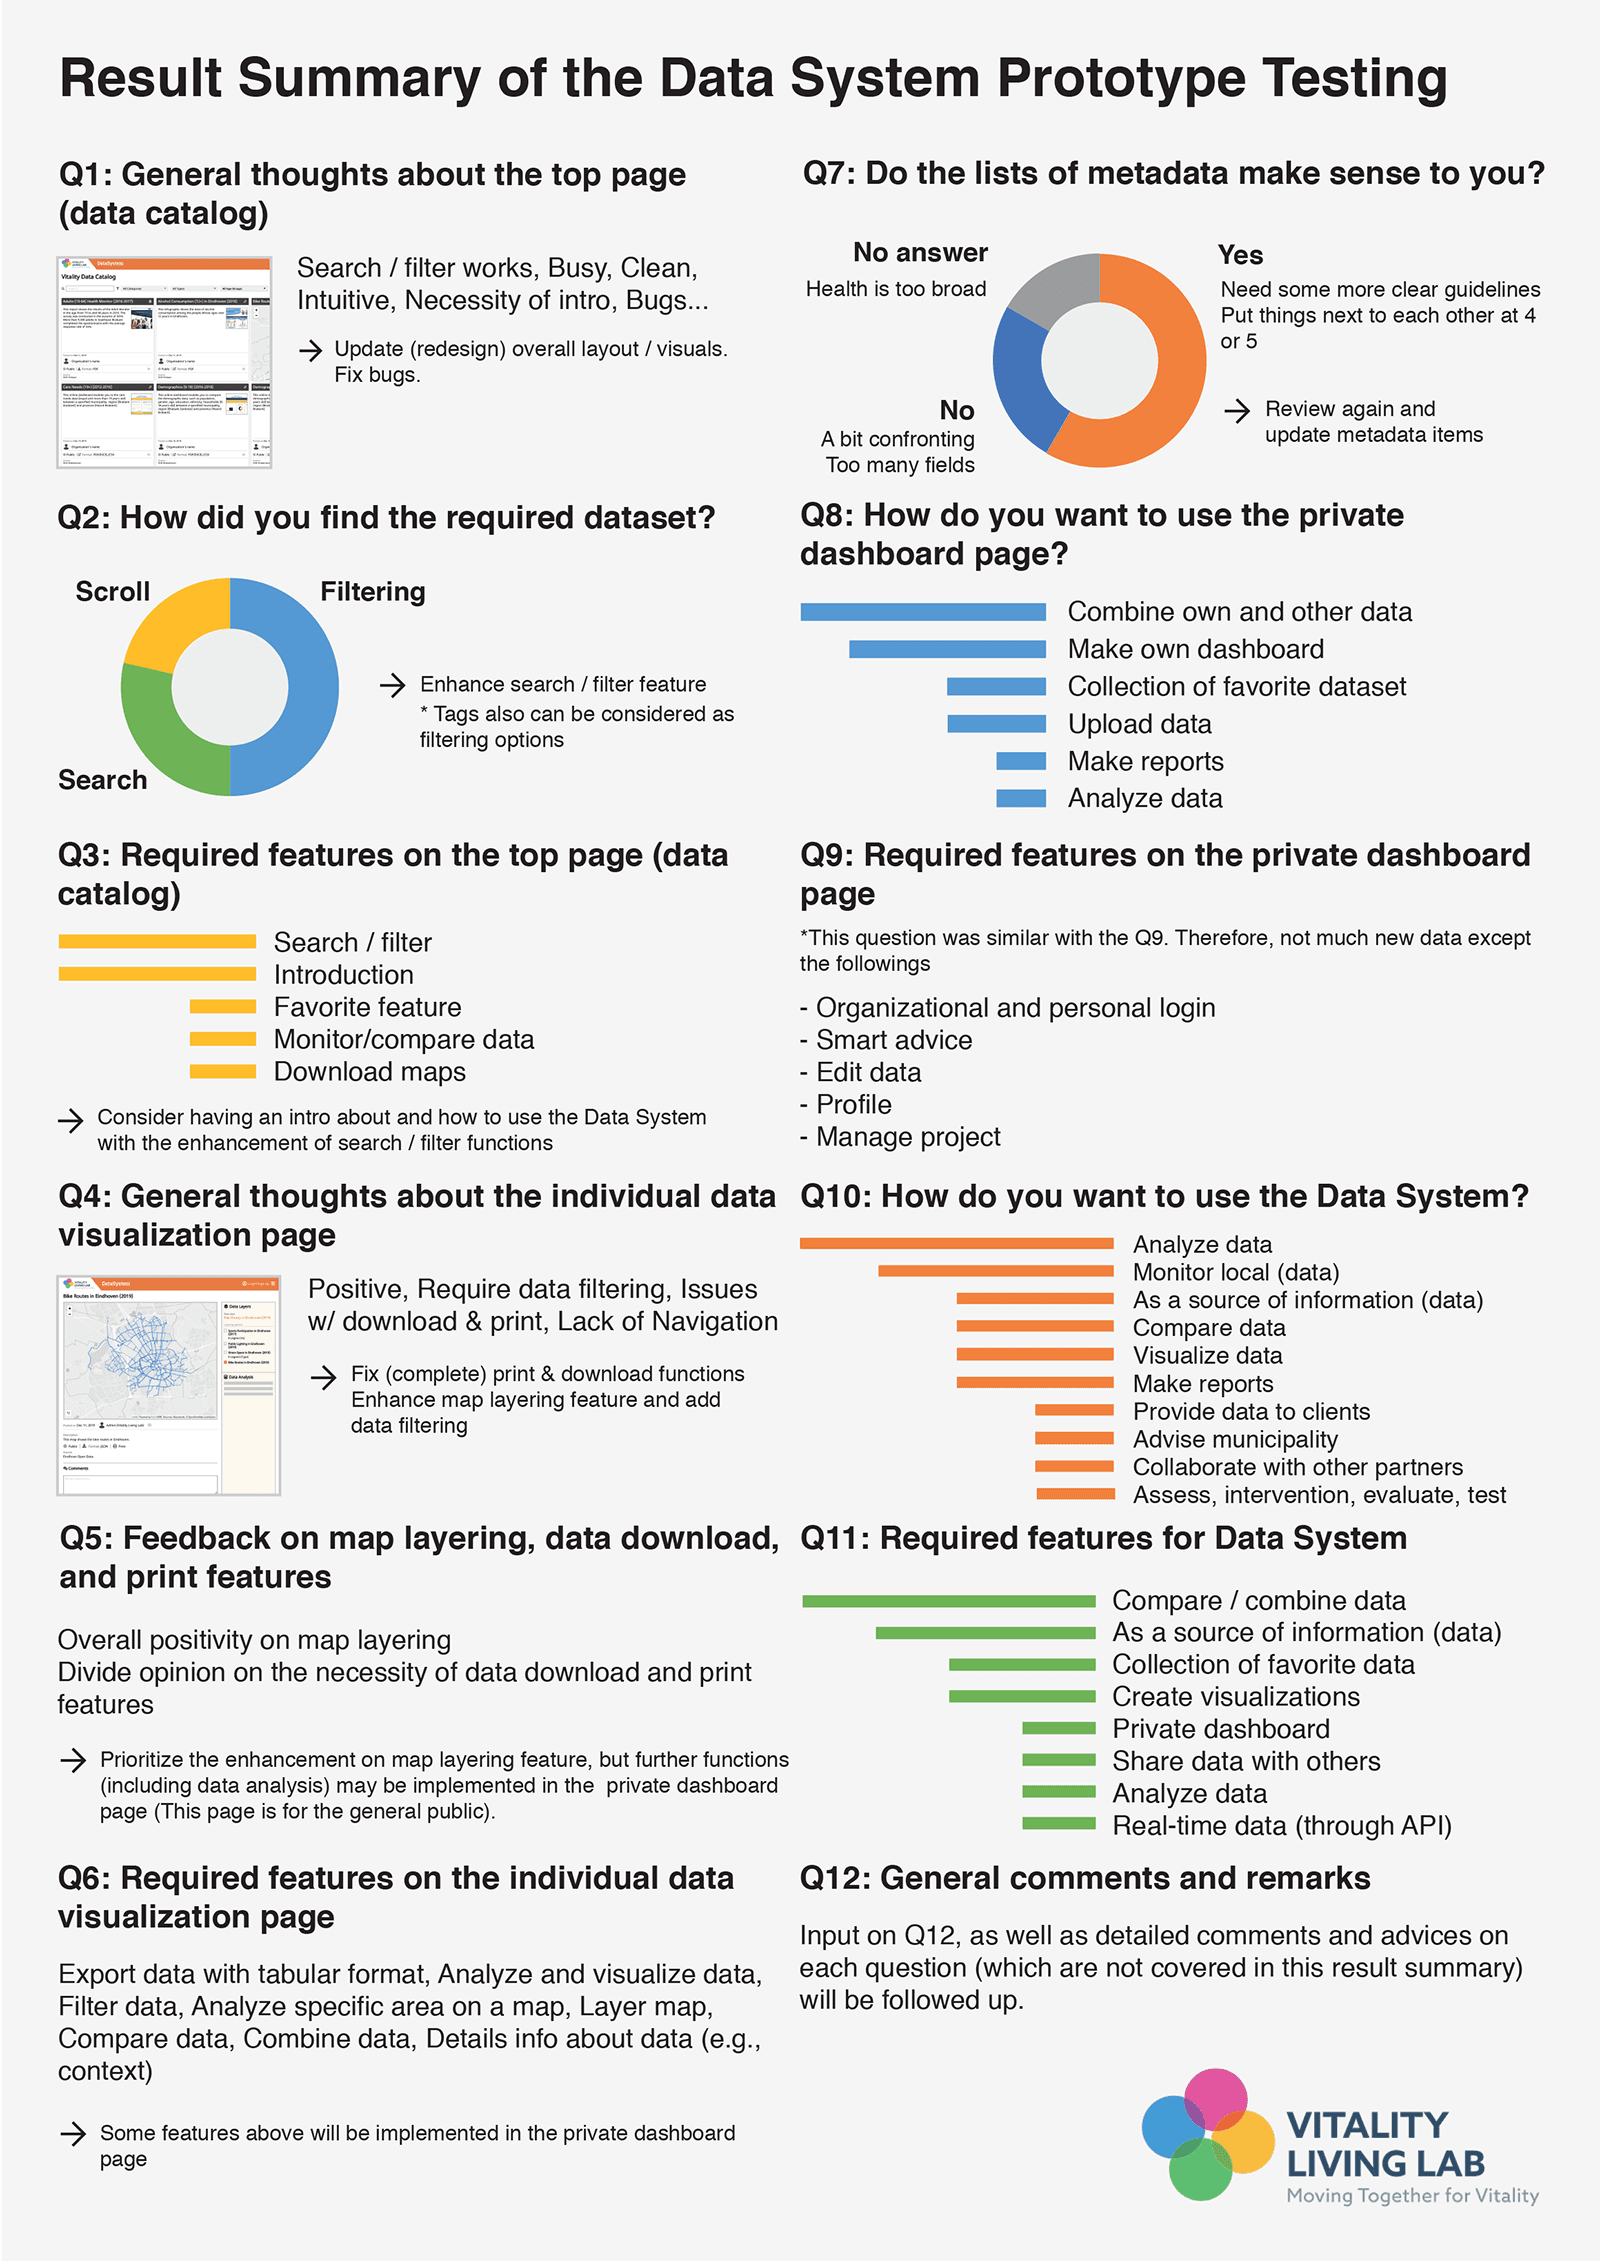
Project Overview
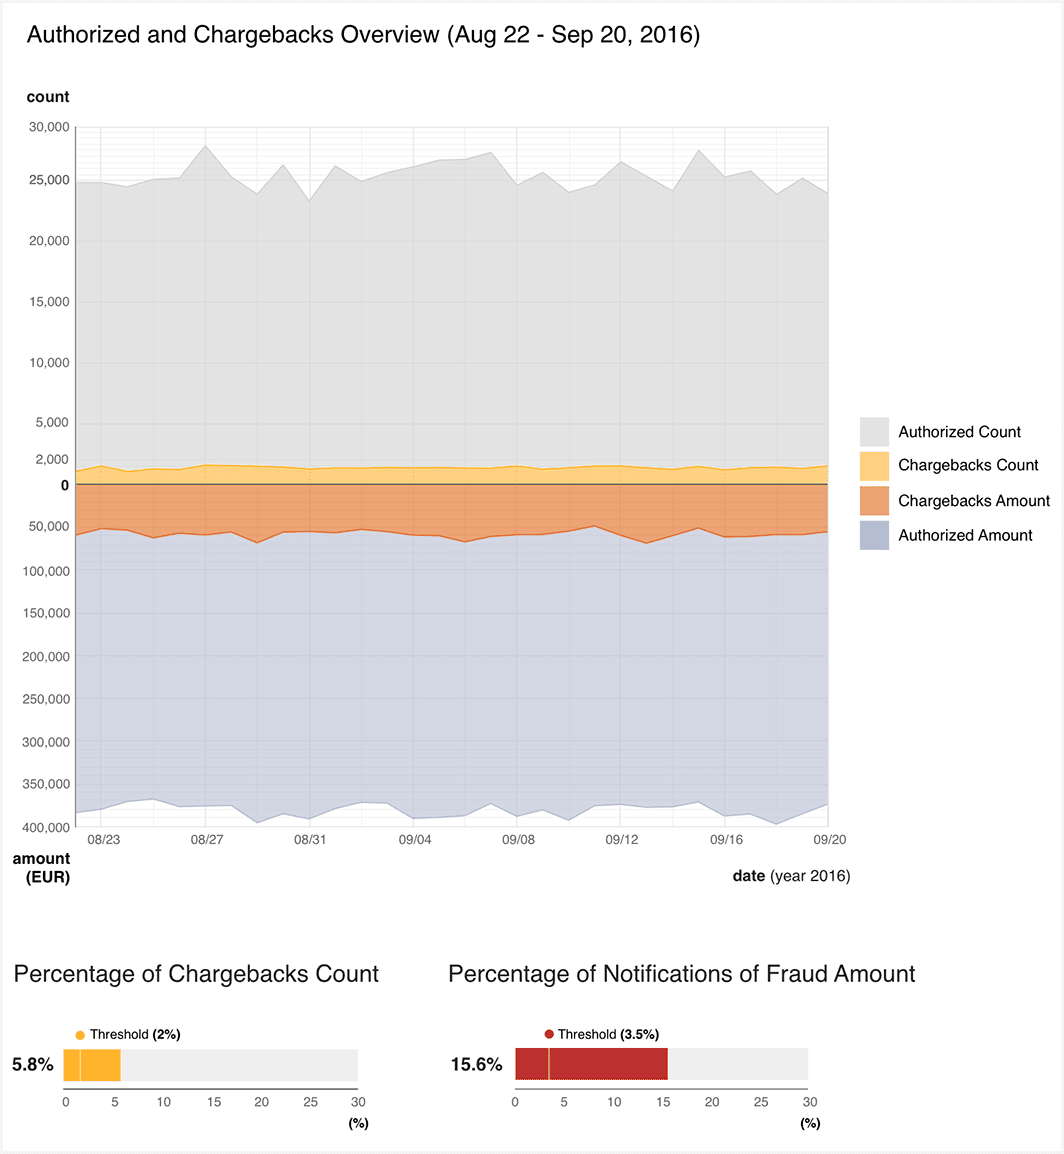
Data Visualization Assignment
This data visualization was created for a part of the recruitment process at a payment company by using R and Sketch app for cleaning up. An online version was also developed separately by D3.js.
D3 · R · Sketch · HTML · CSS · JavaScript
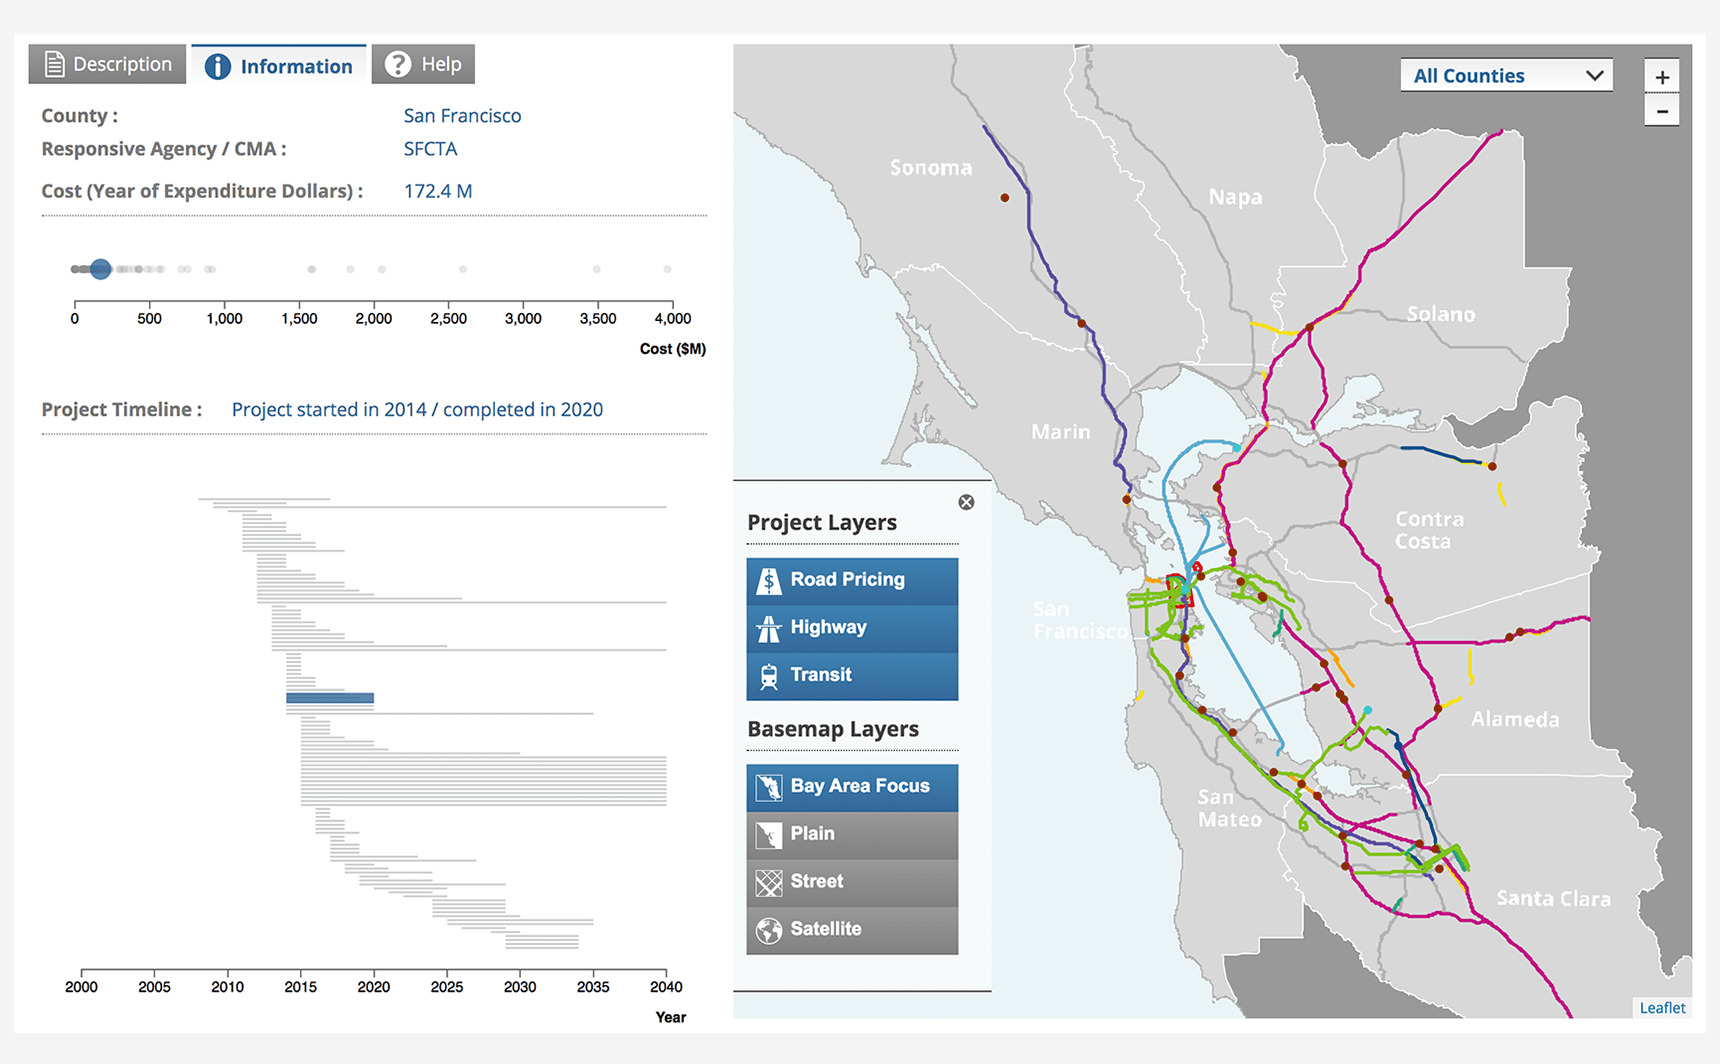
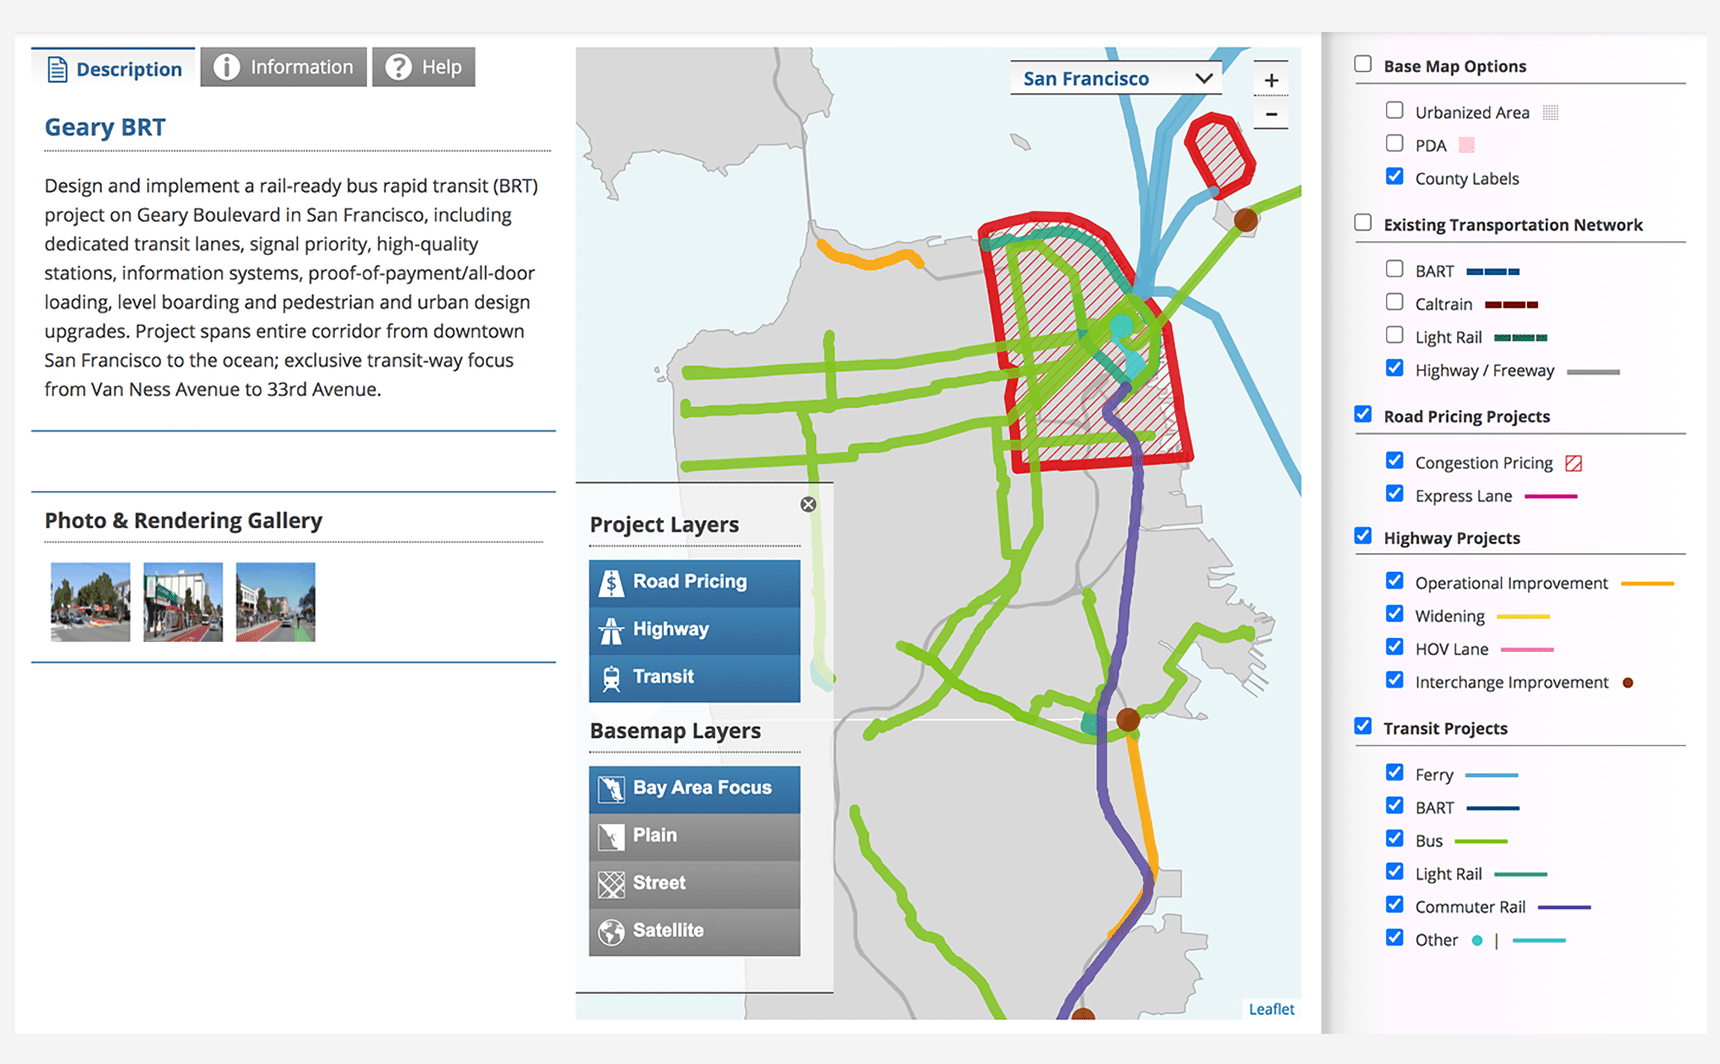
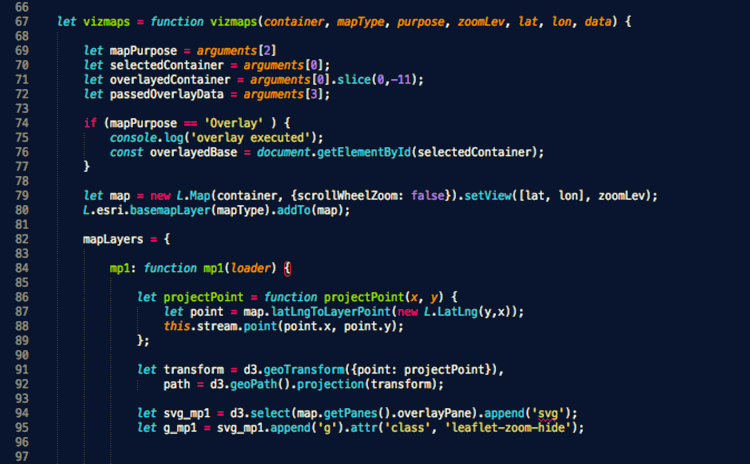
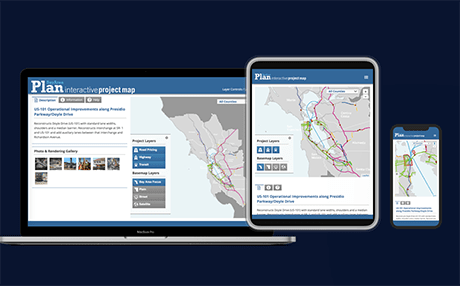
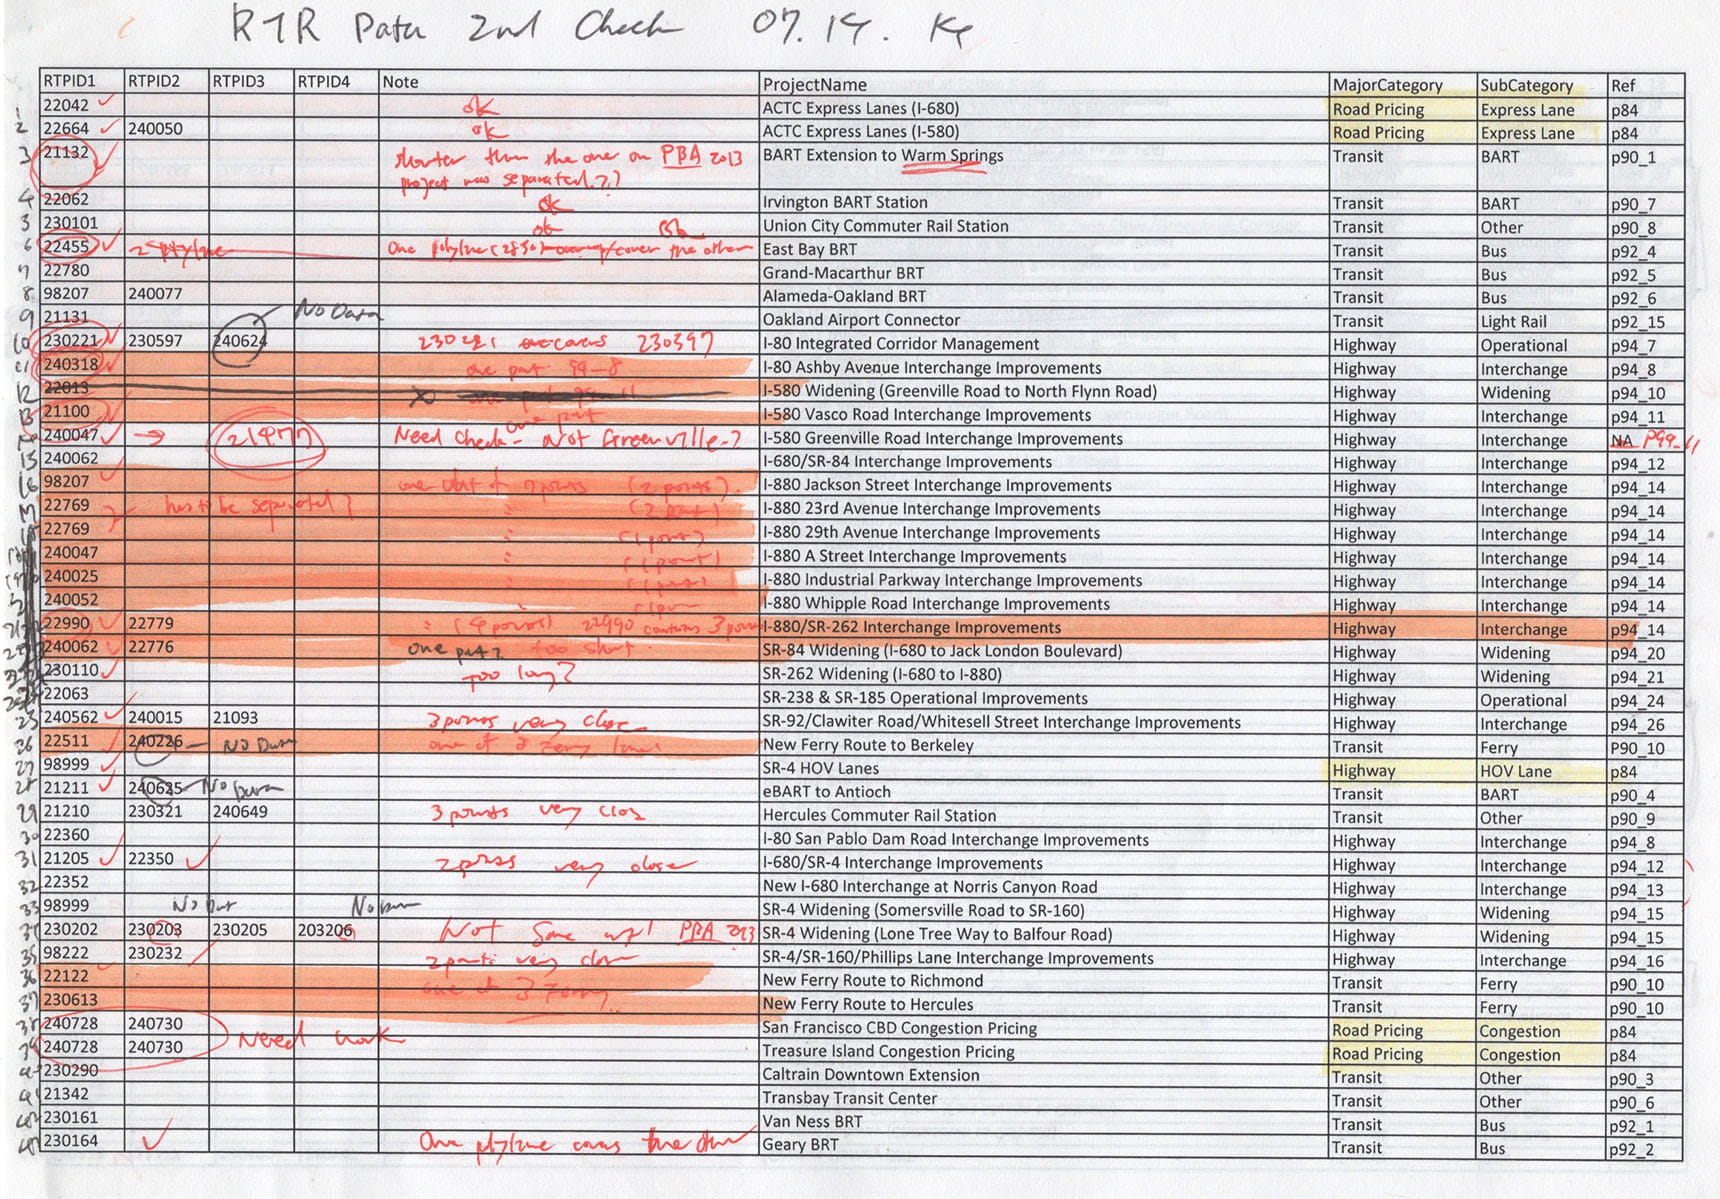
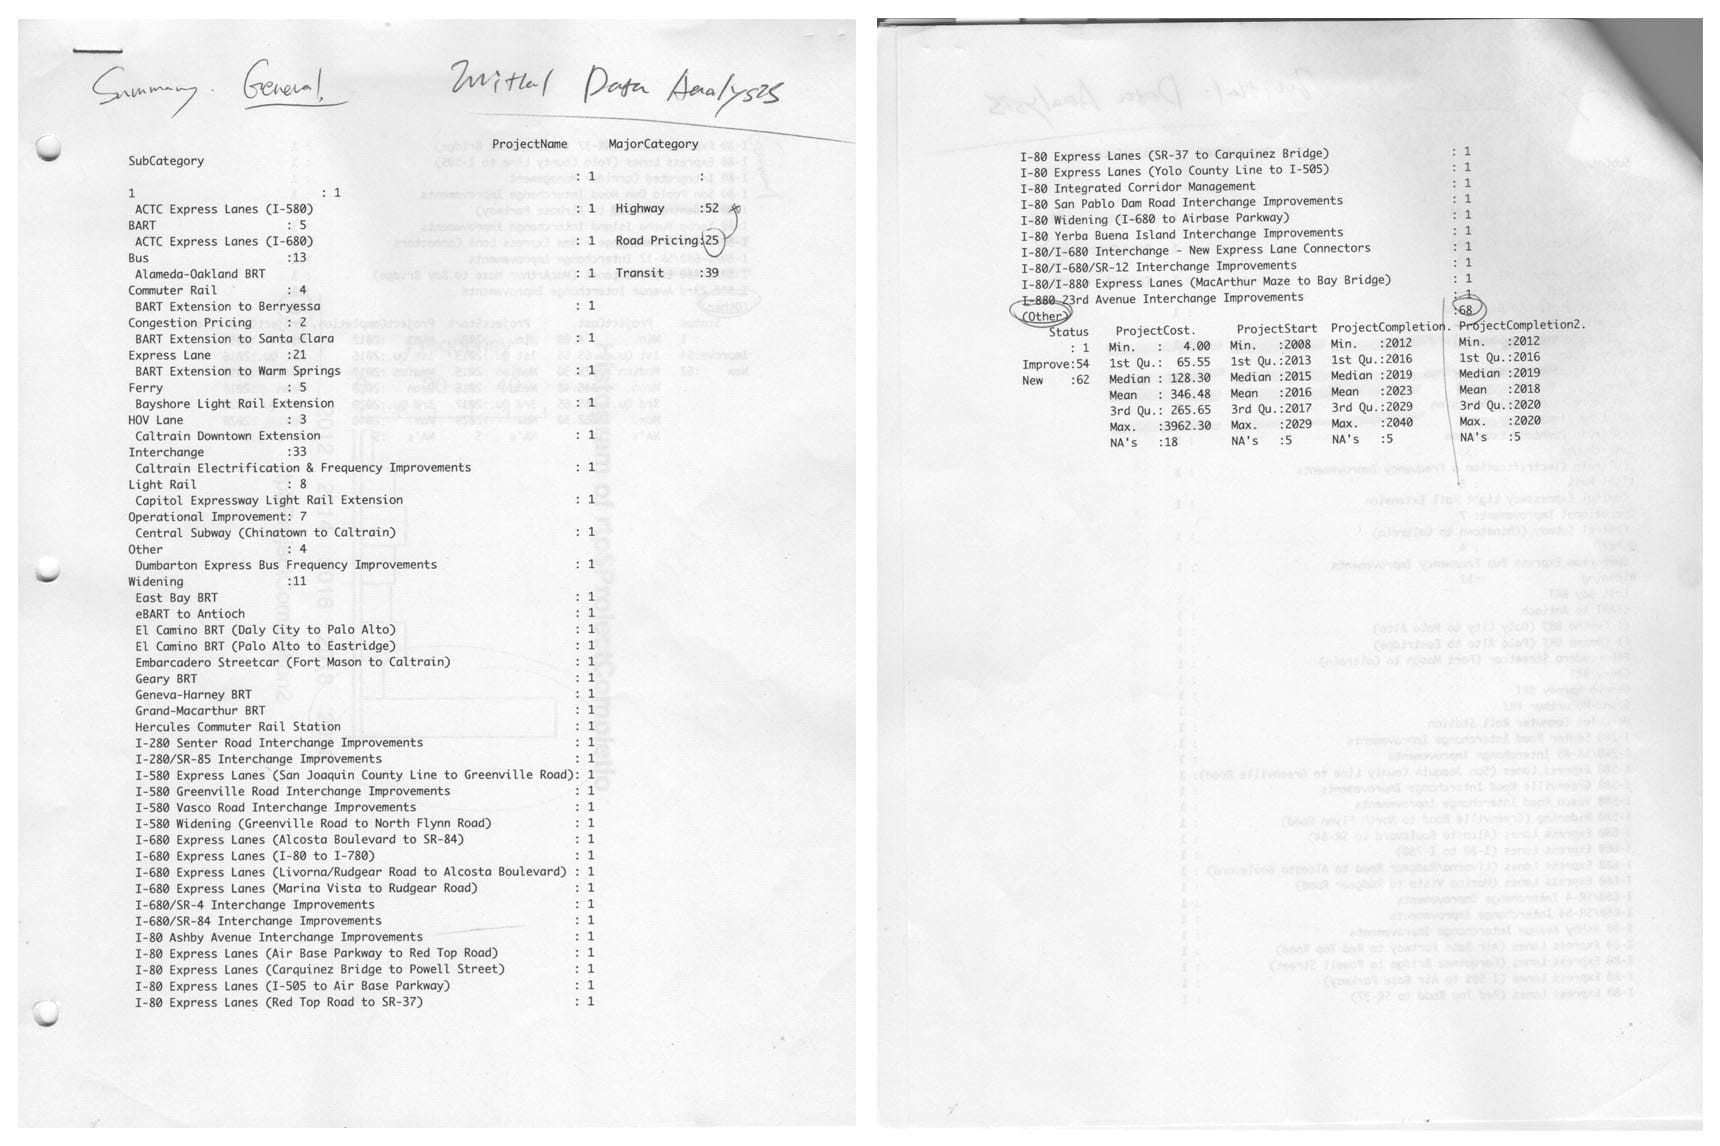
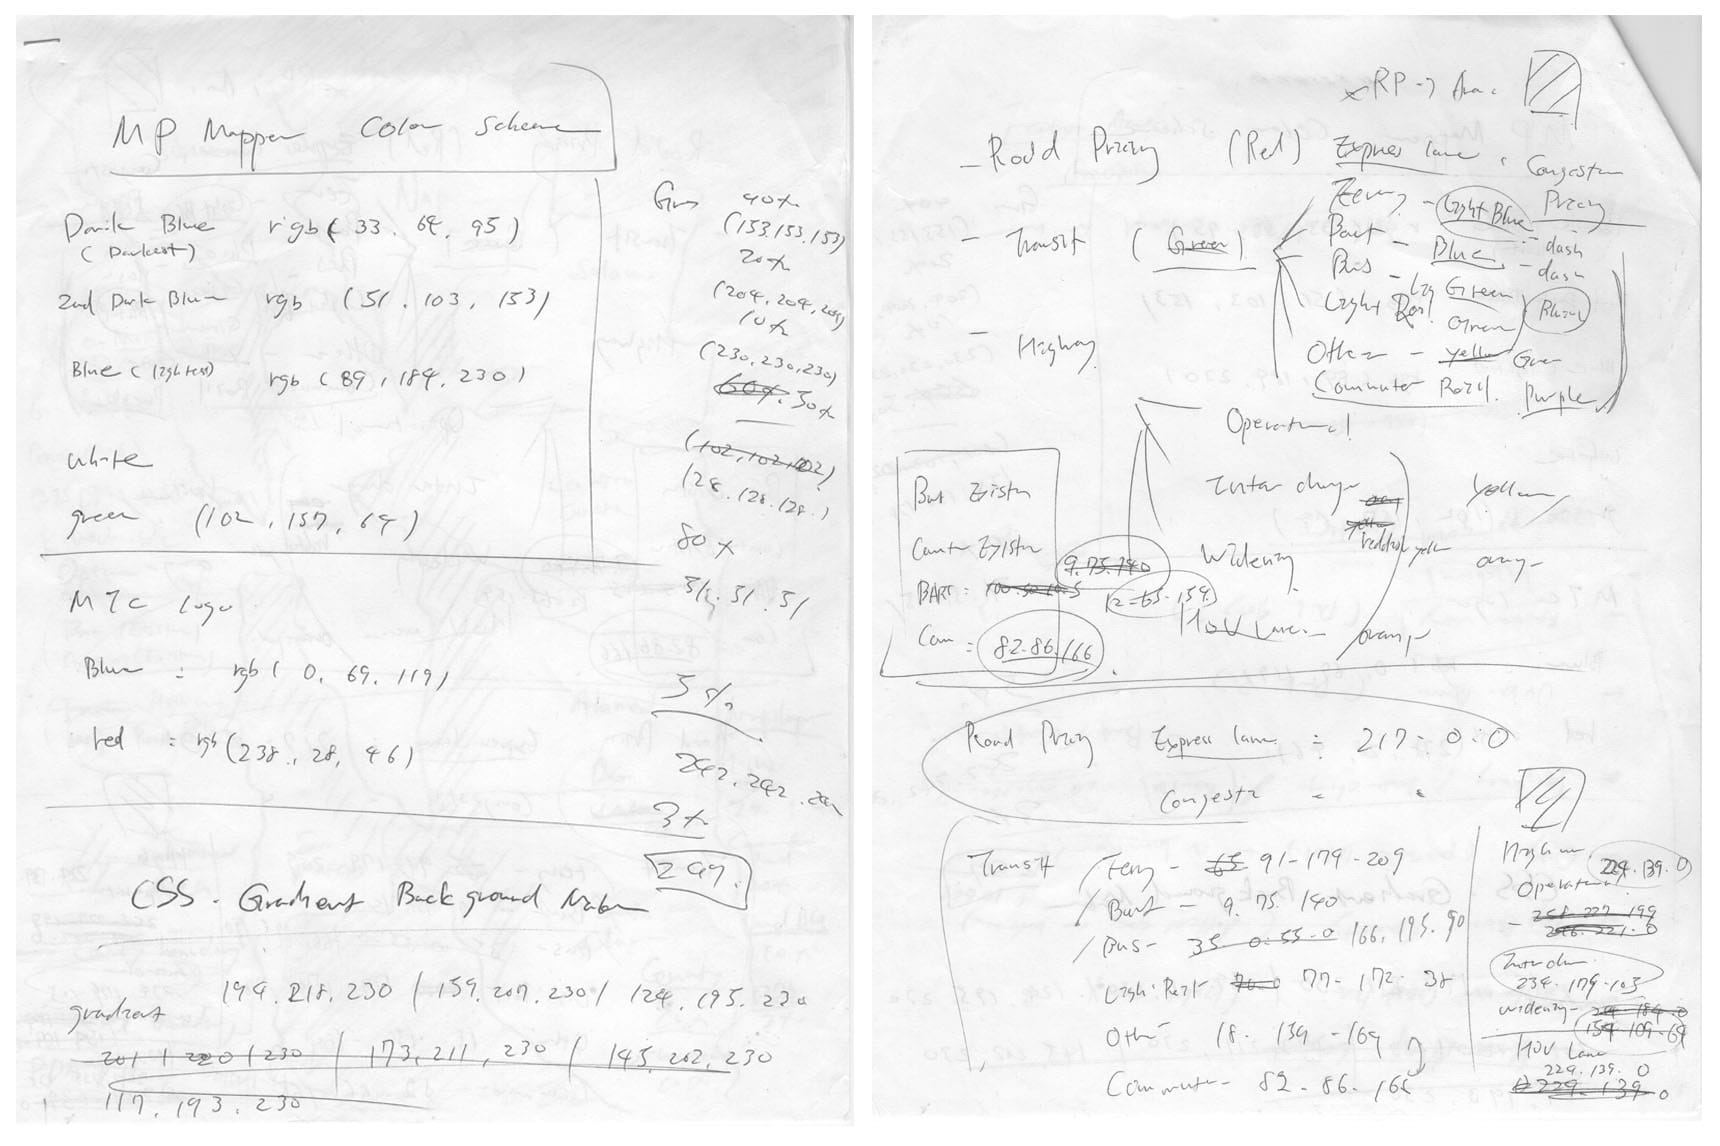
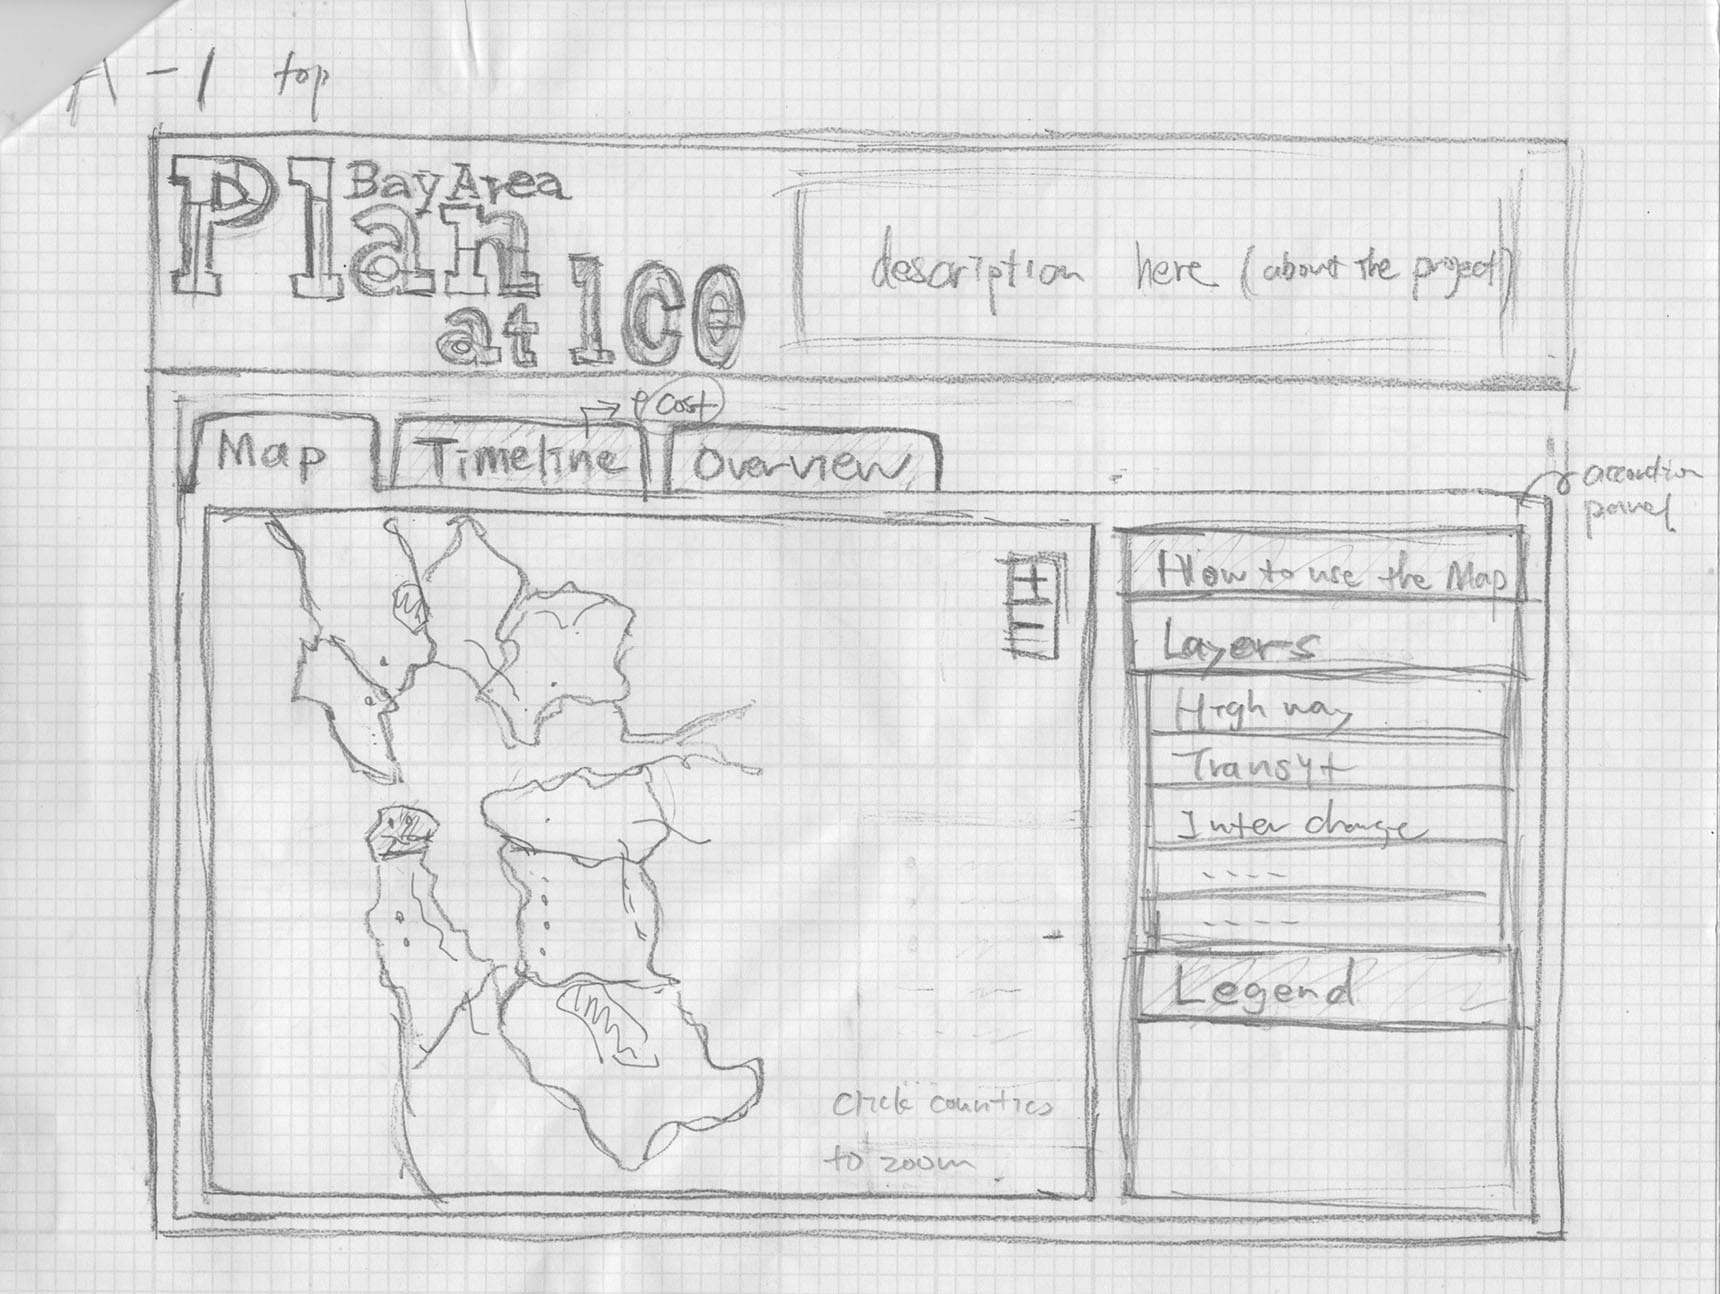
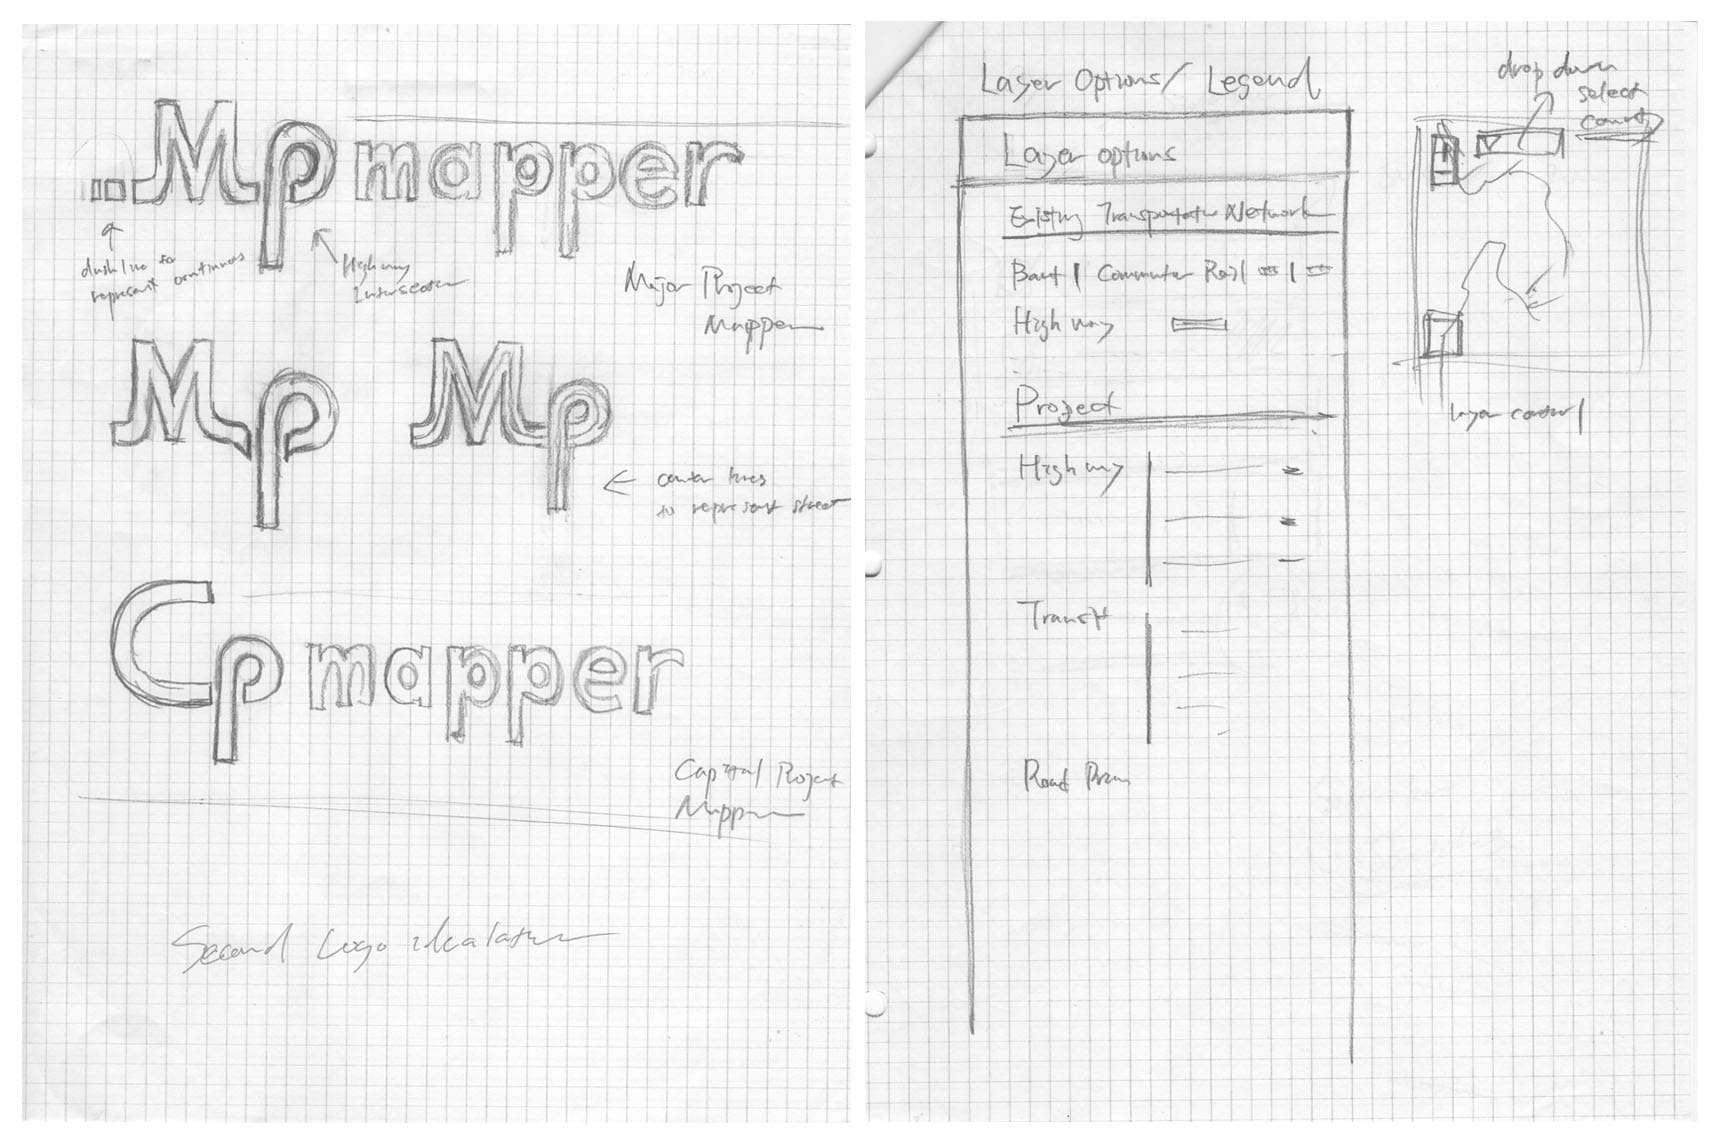
Project Mapper
Project Mapper shows major transportation projects in the San Francisco Bay Area with several different aspects such as cost, duration and geographical extent. Starting with data collection, I took charge of the entire process of production from ideation to development for MTC (Metropolitan Transportation Commission). ESRI's ArcGIS and GDAL's ogr2ogr are mainly used for the creation of geographical data for the web (GeoJSON) as well as R for exploratory data analysis. D3.js and Leaflet (JavaScript libraries) are used to make data visualizations on this application.
HTML · CSS · JavaScript · D3 · Leaflet · ArcGIS · R · Illustrator · Photoshop
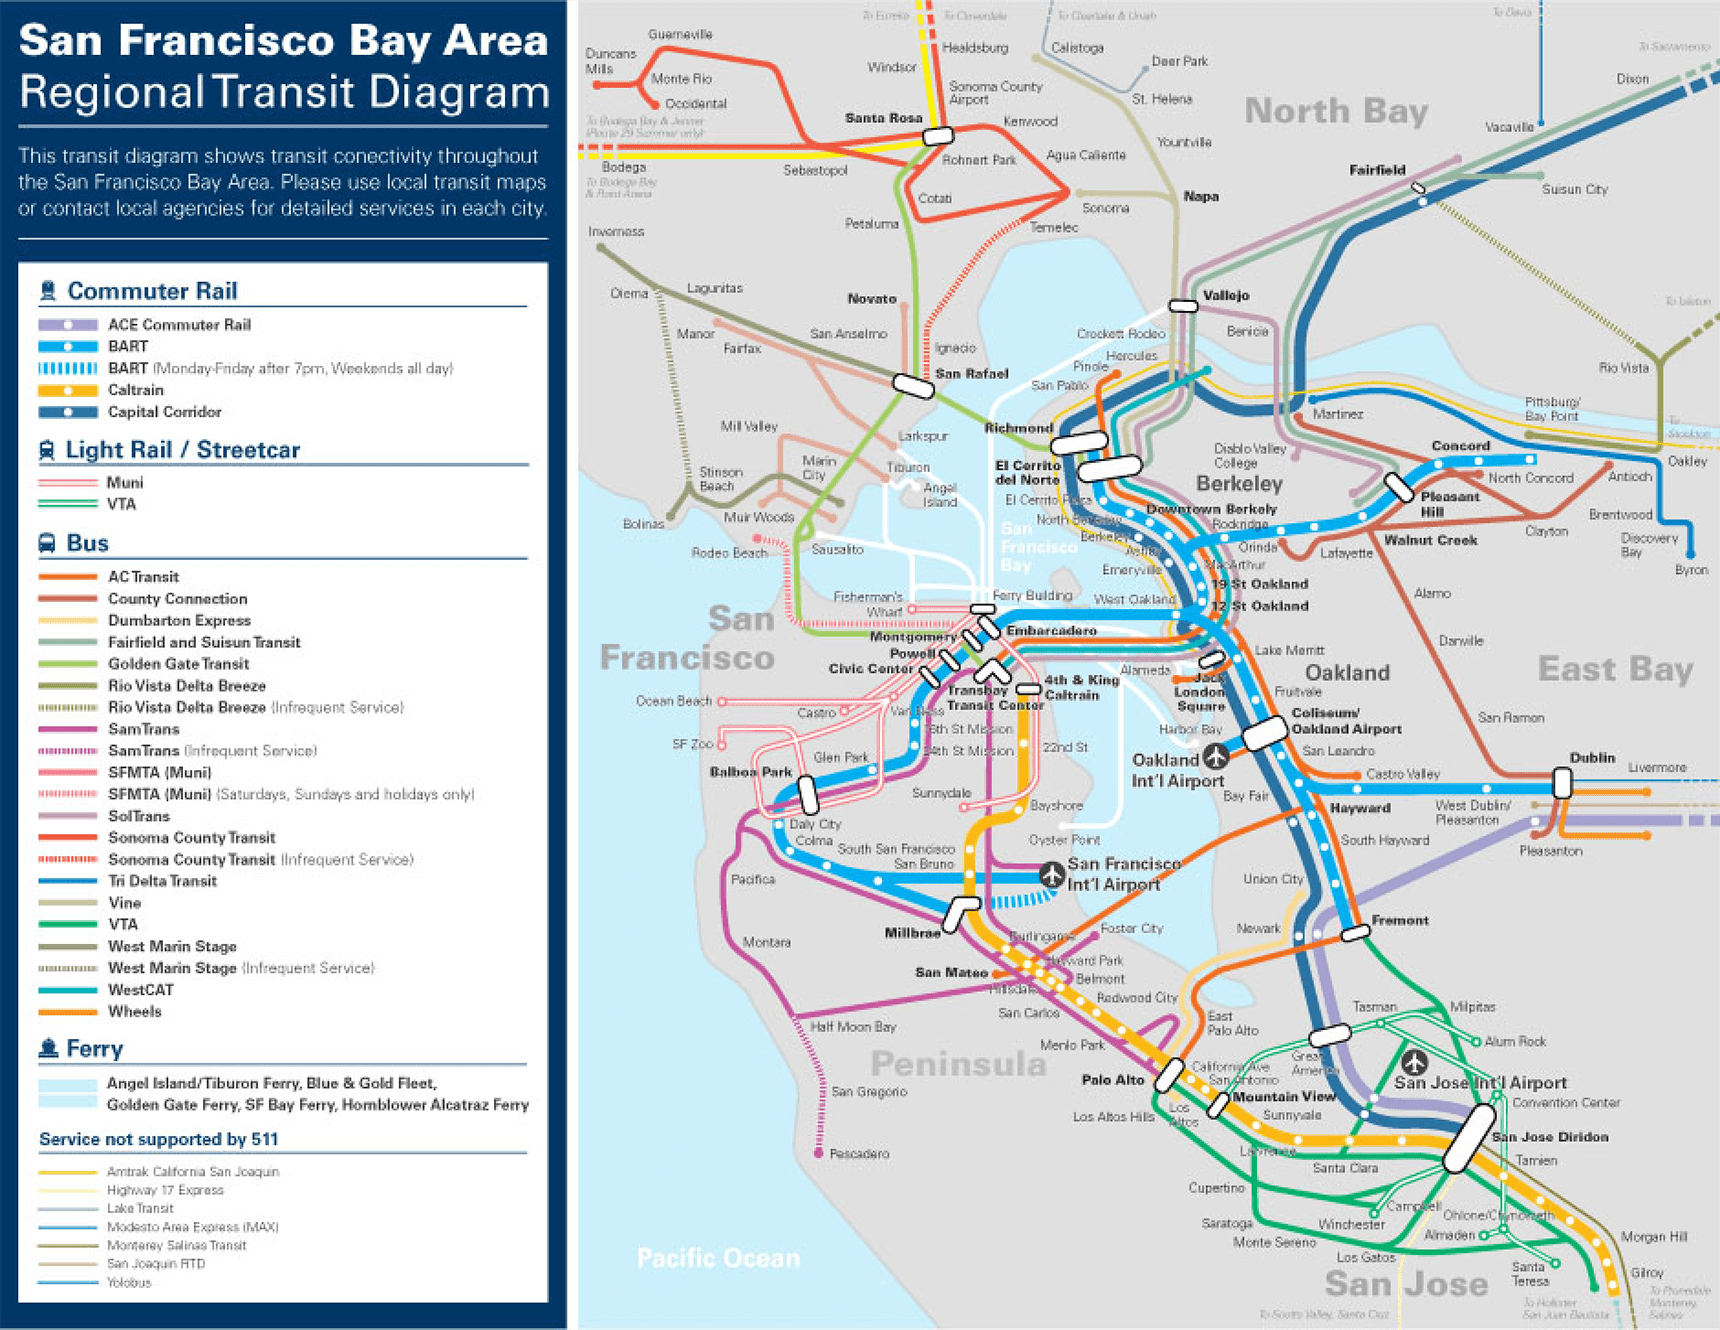
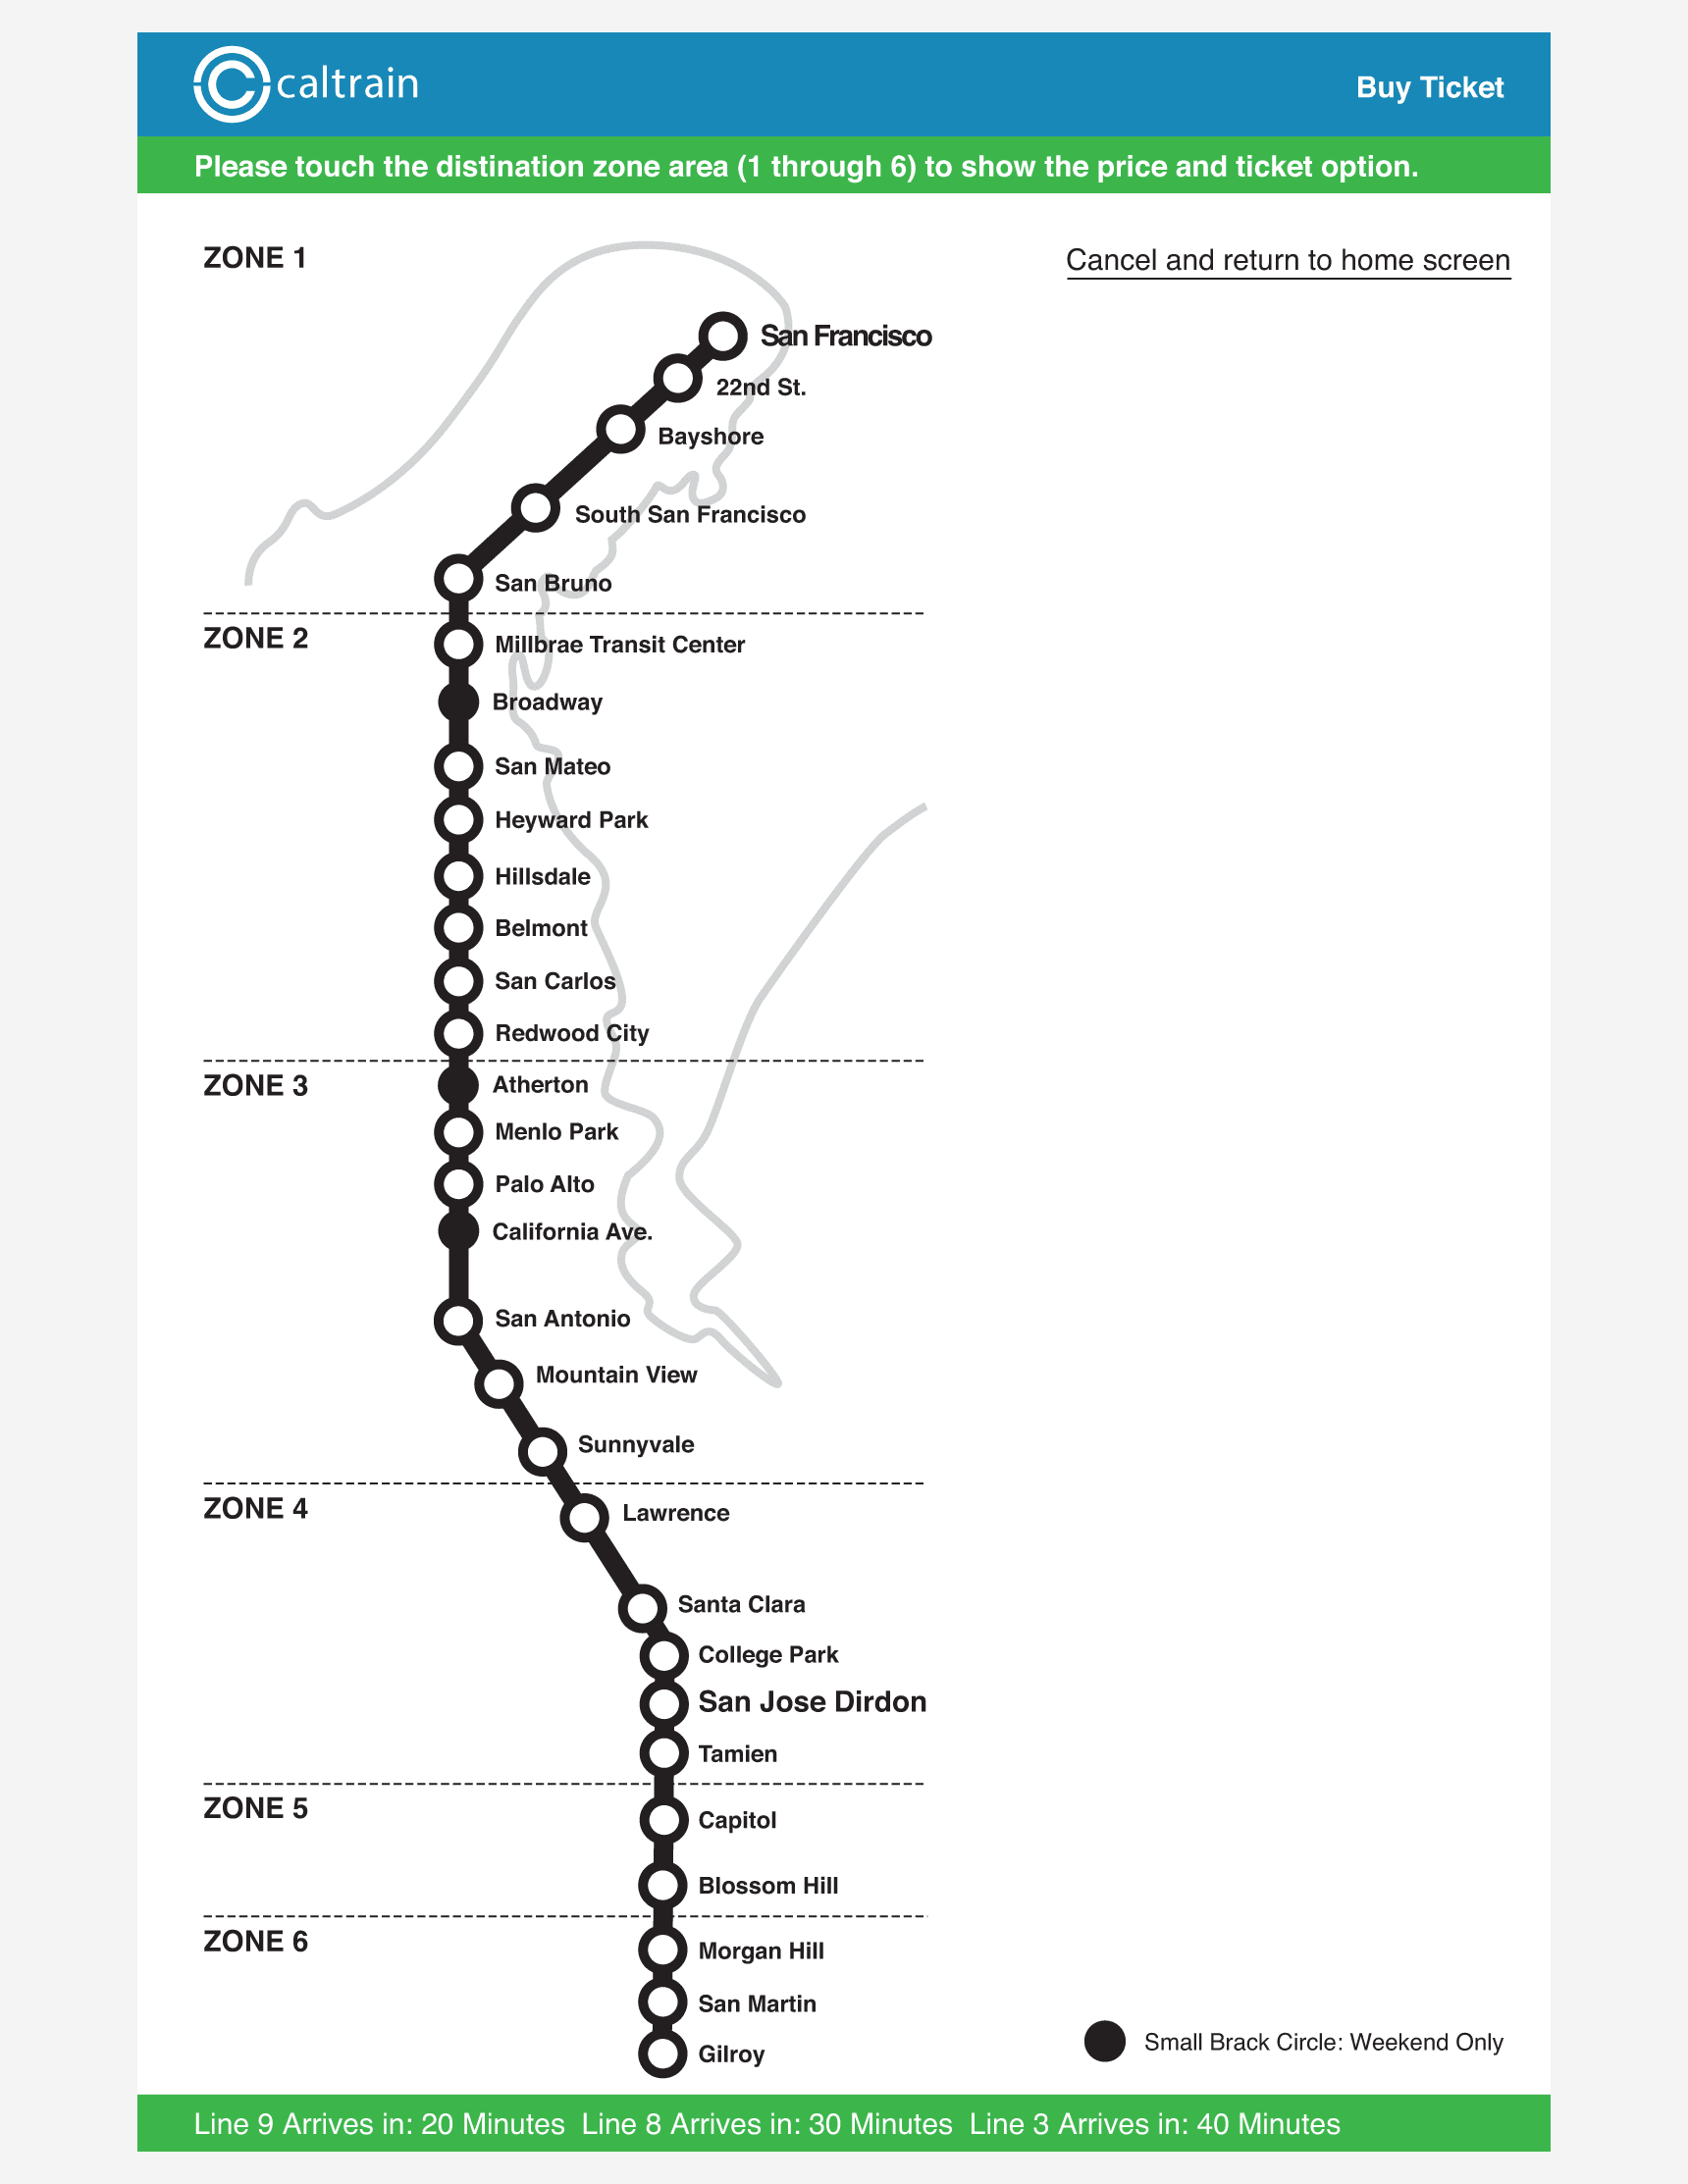
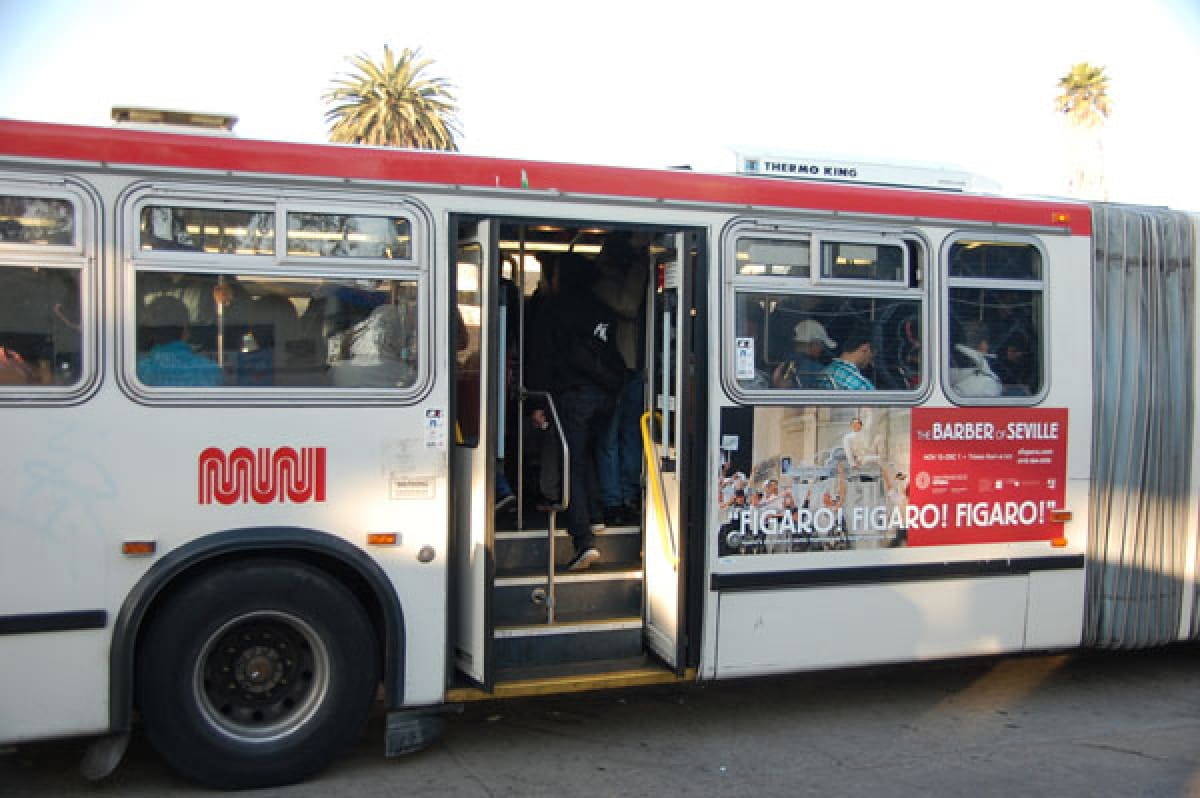
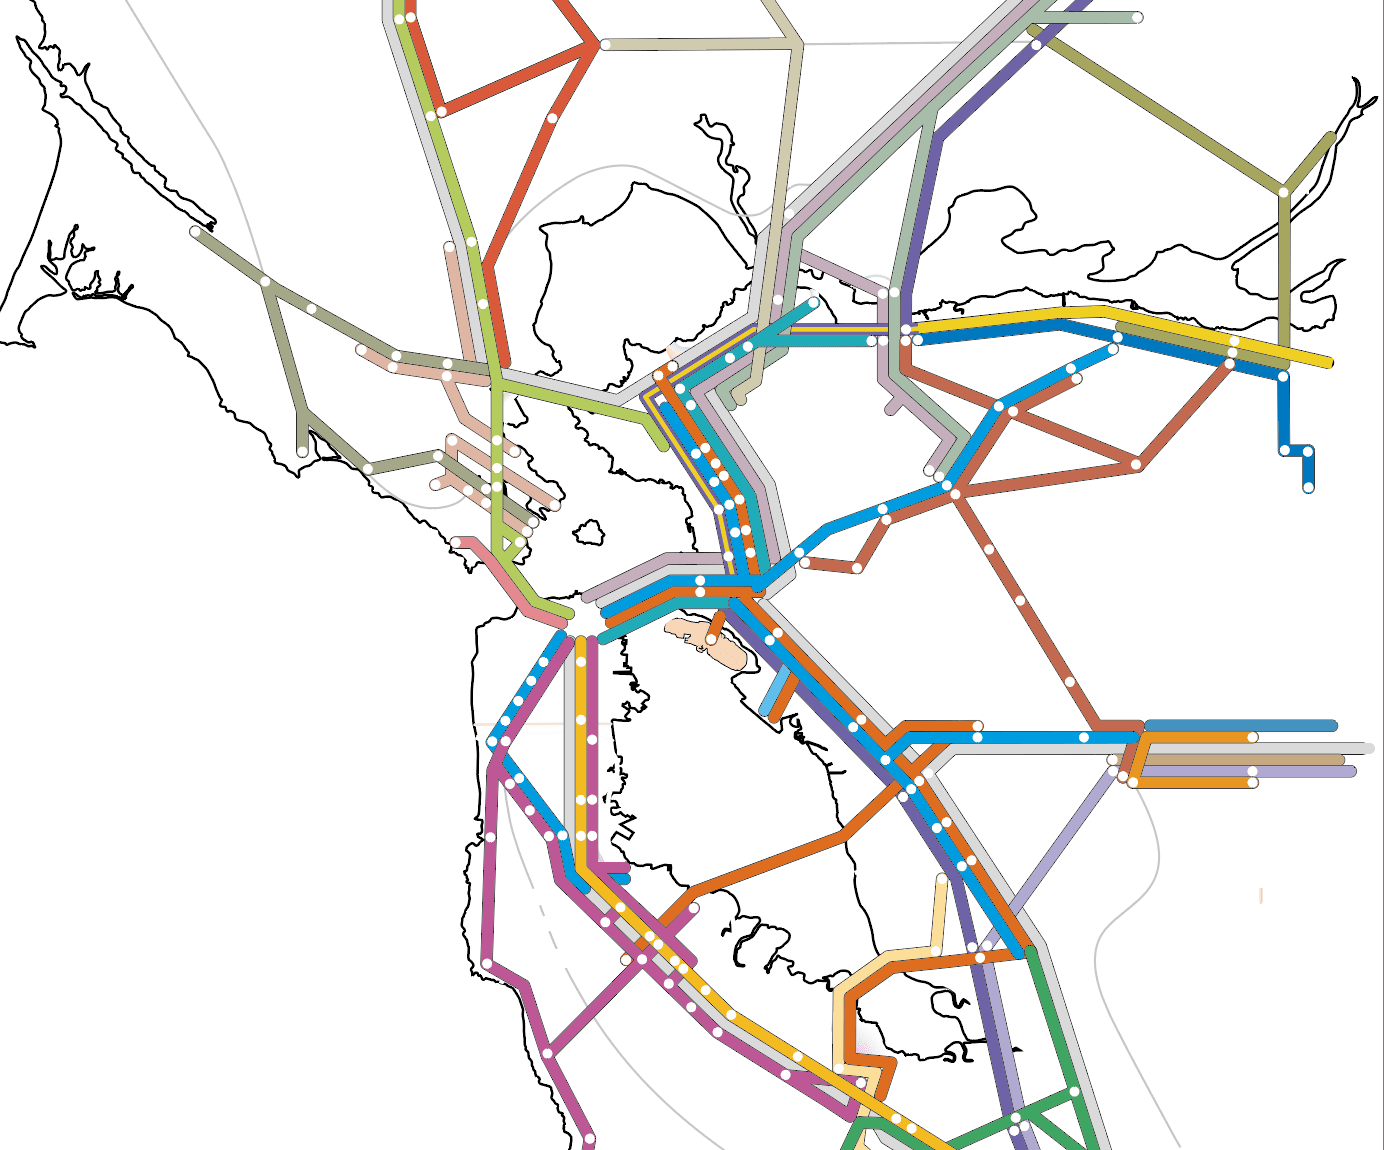
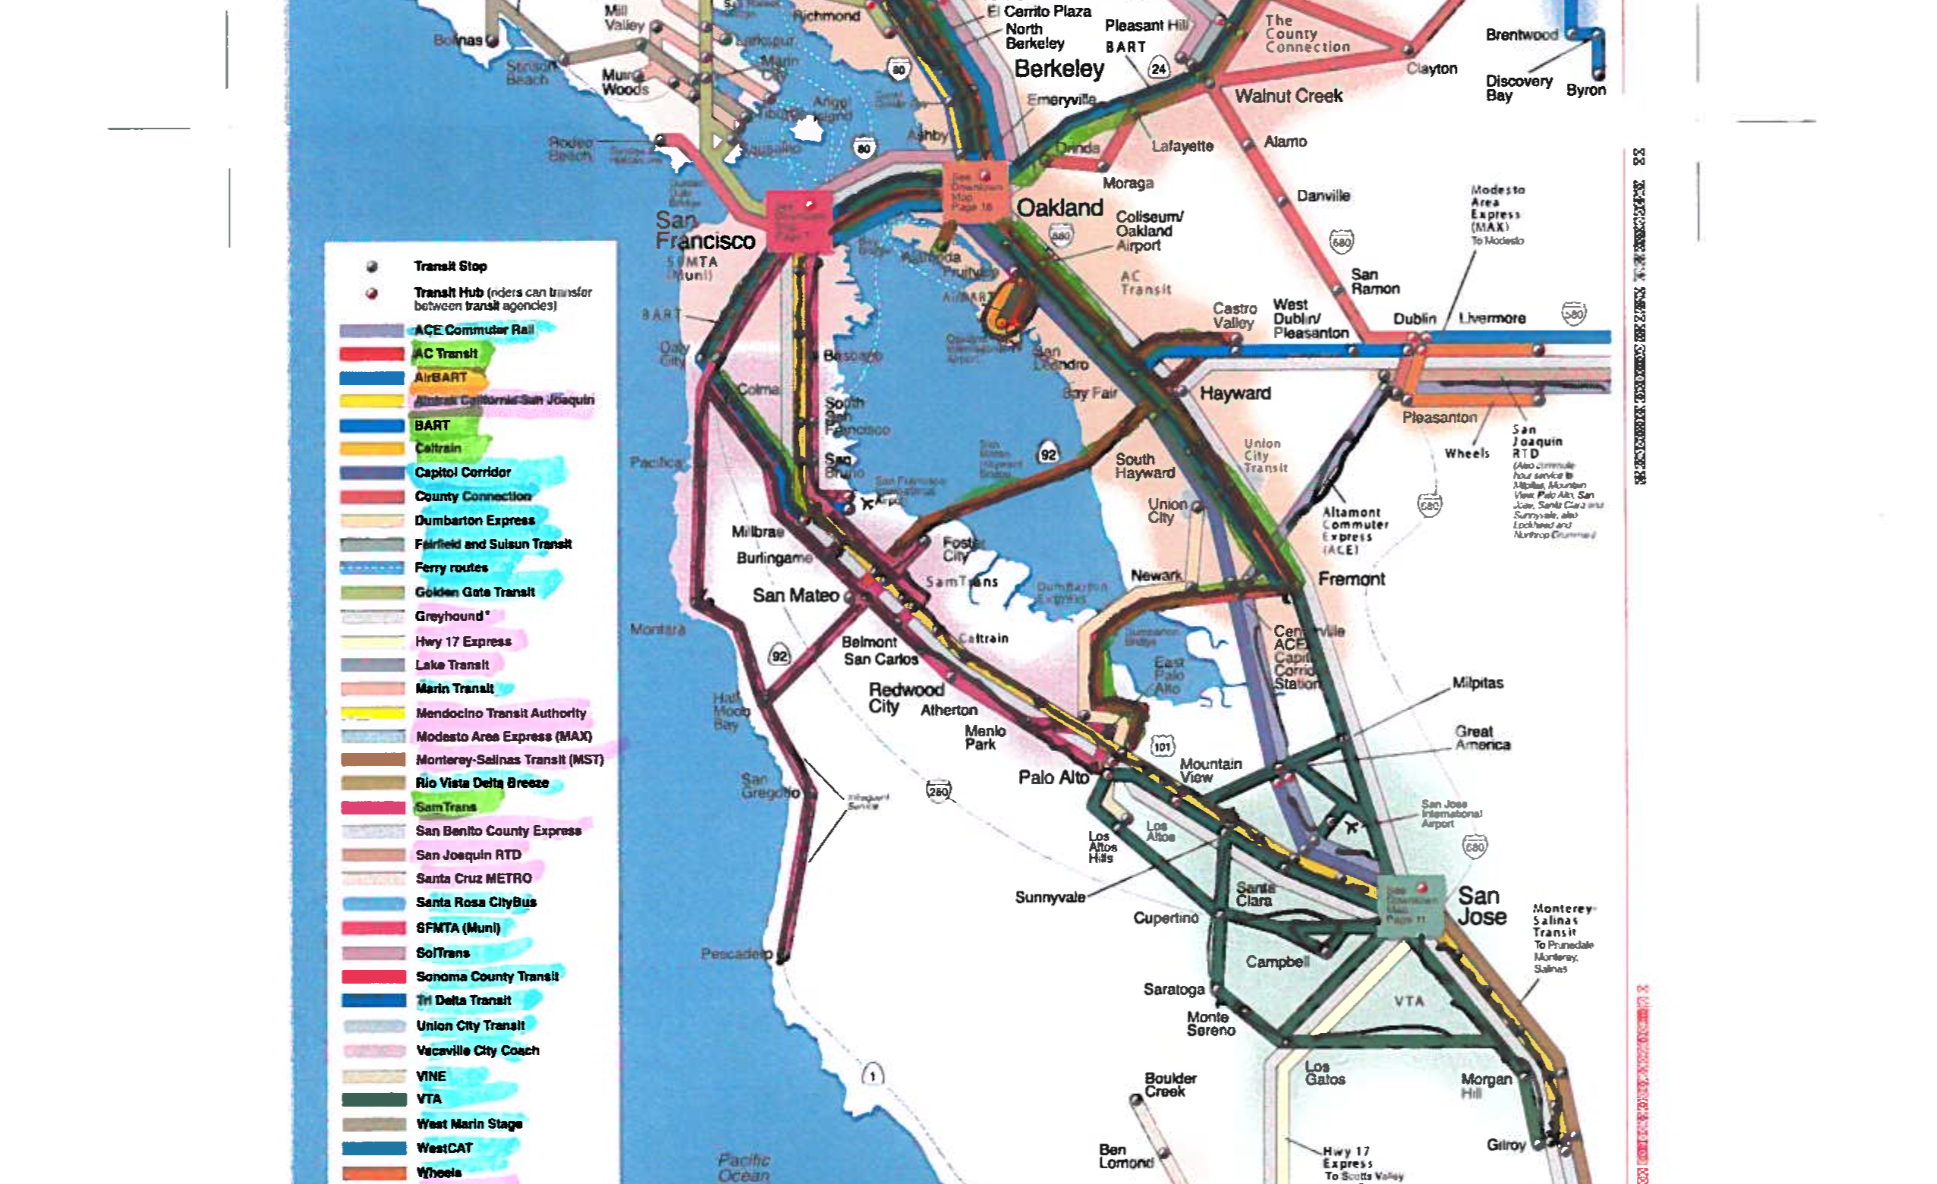
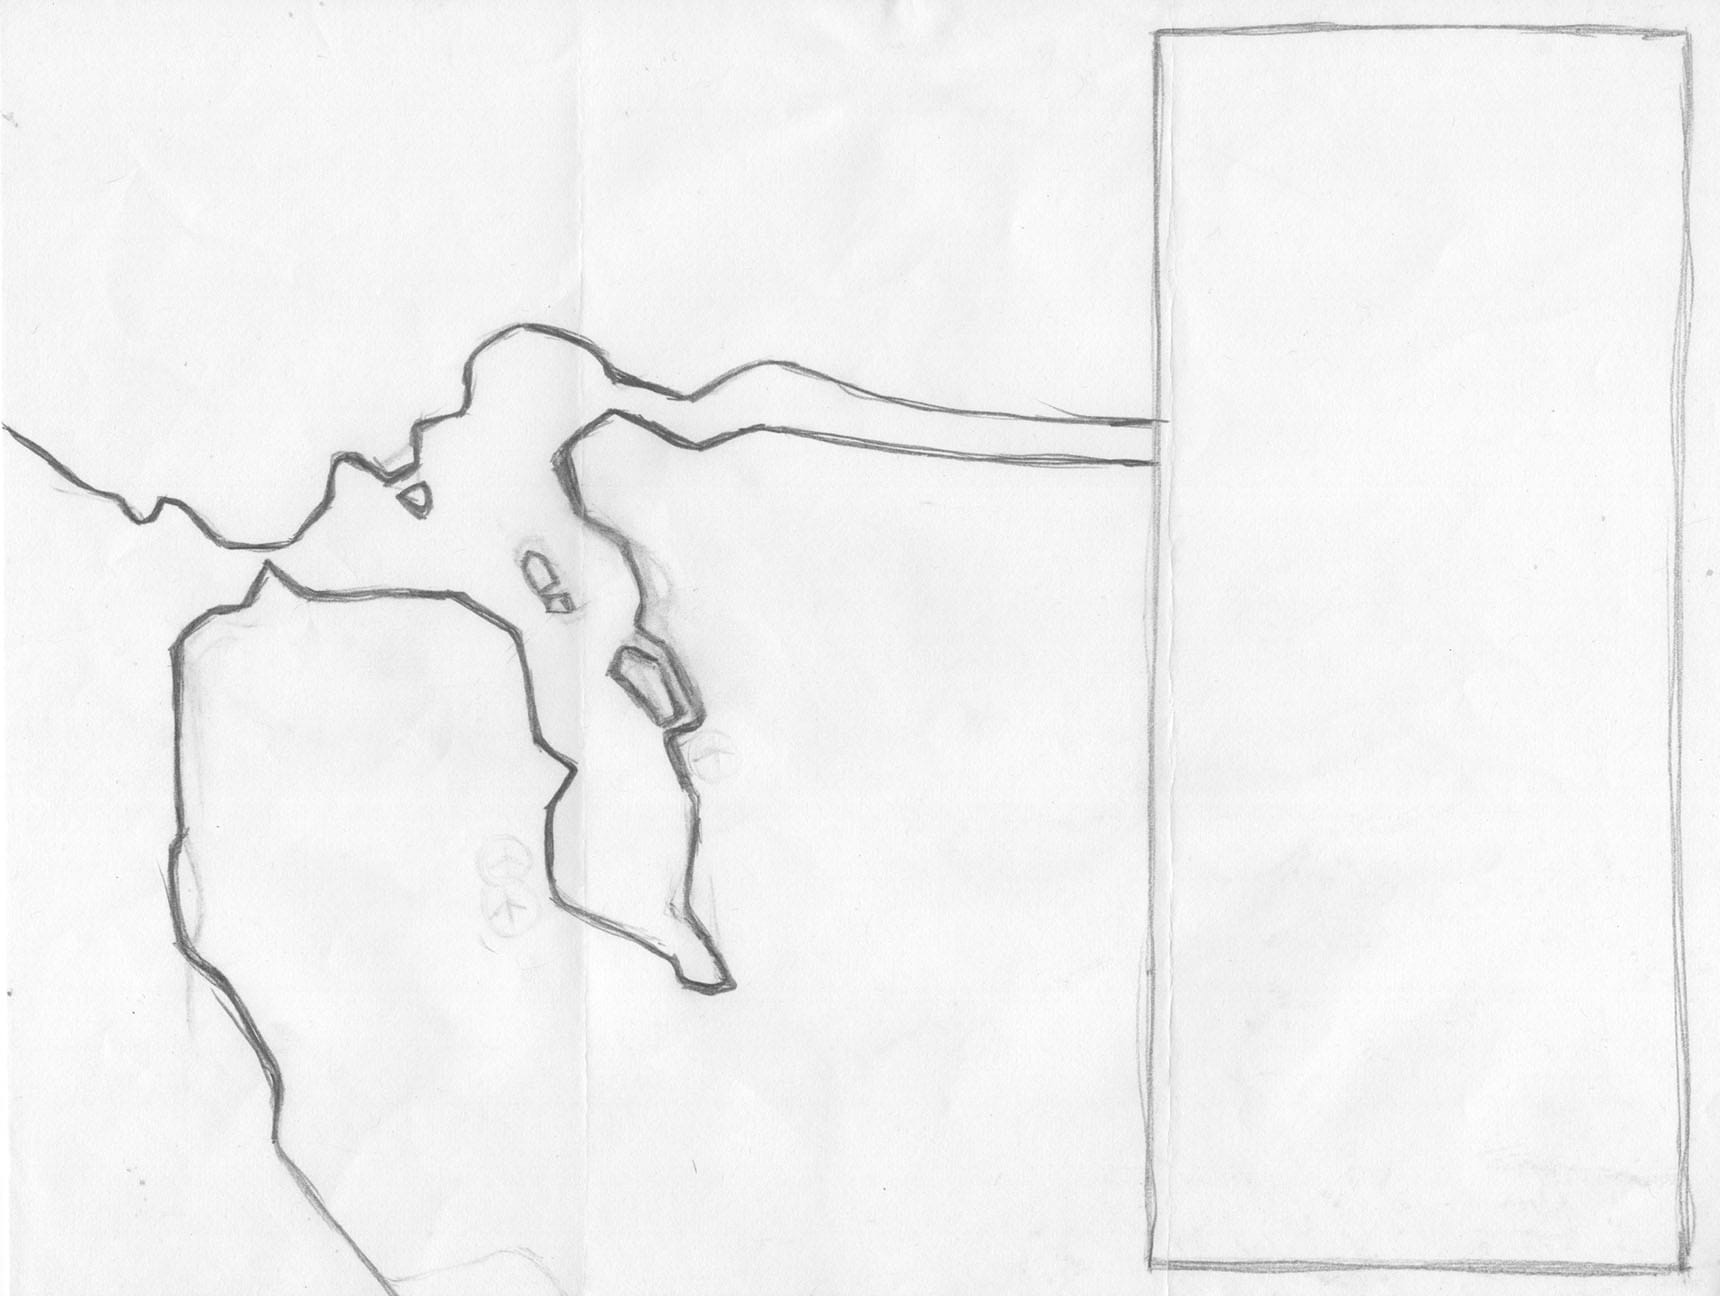
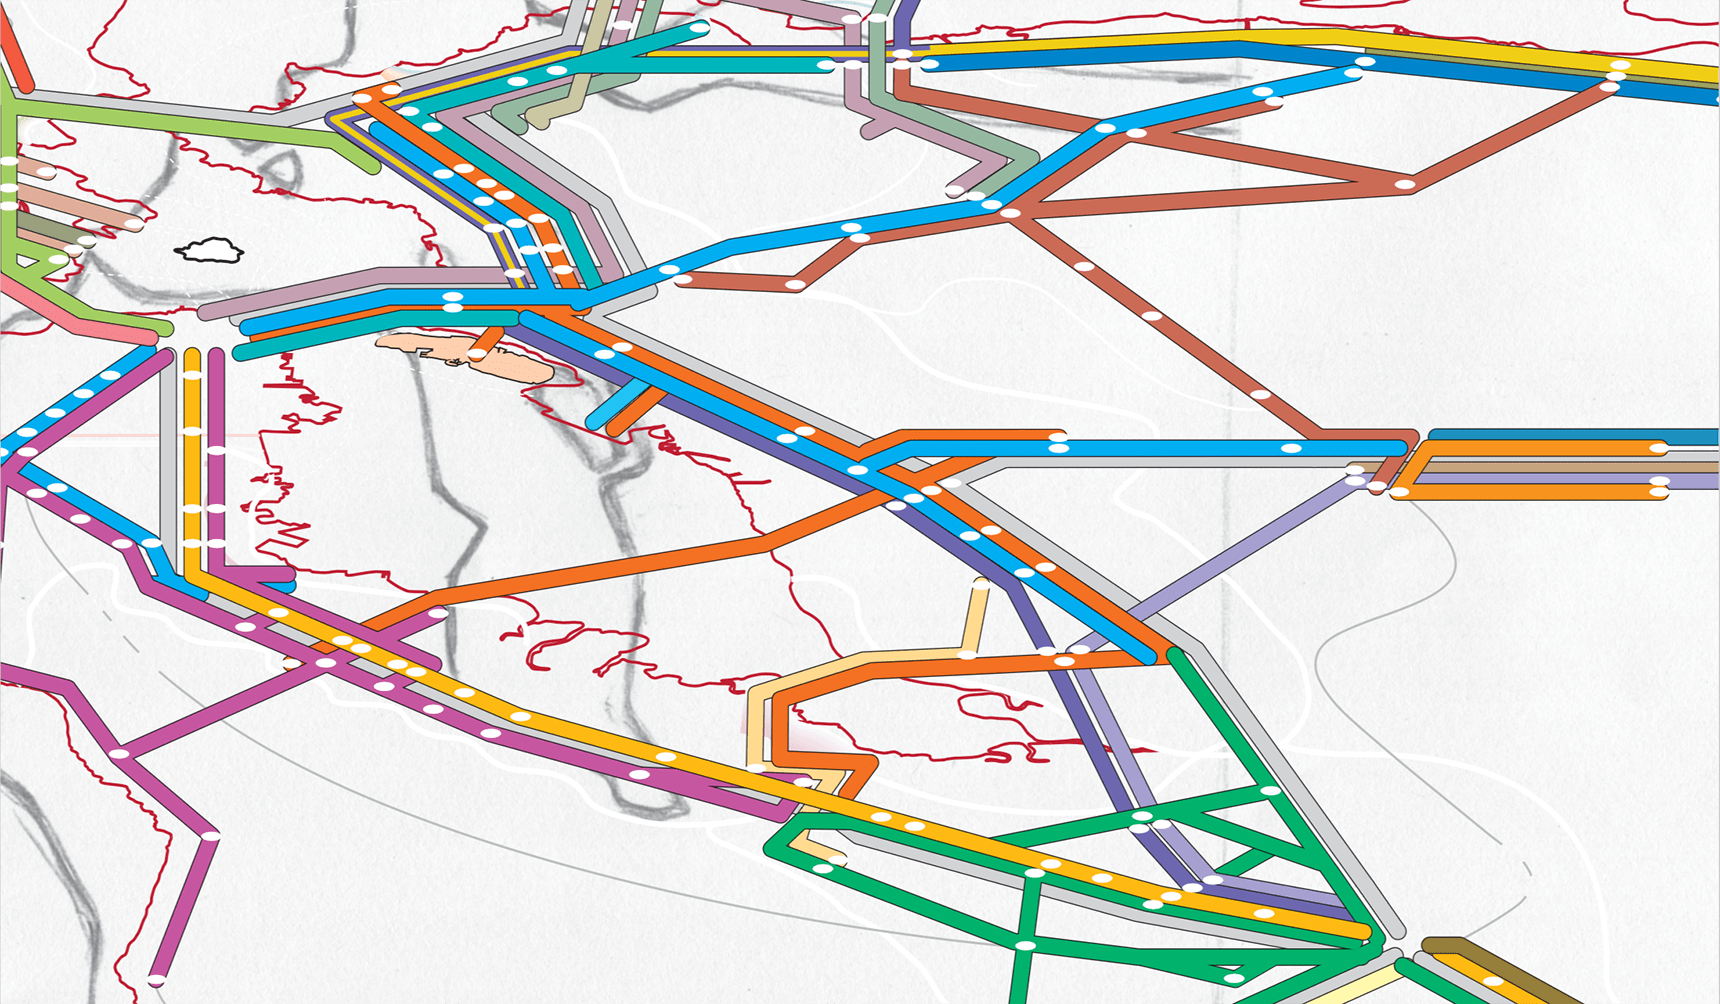
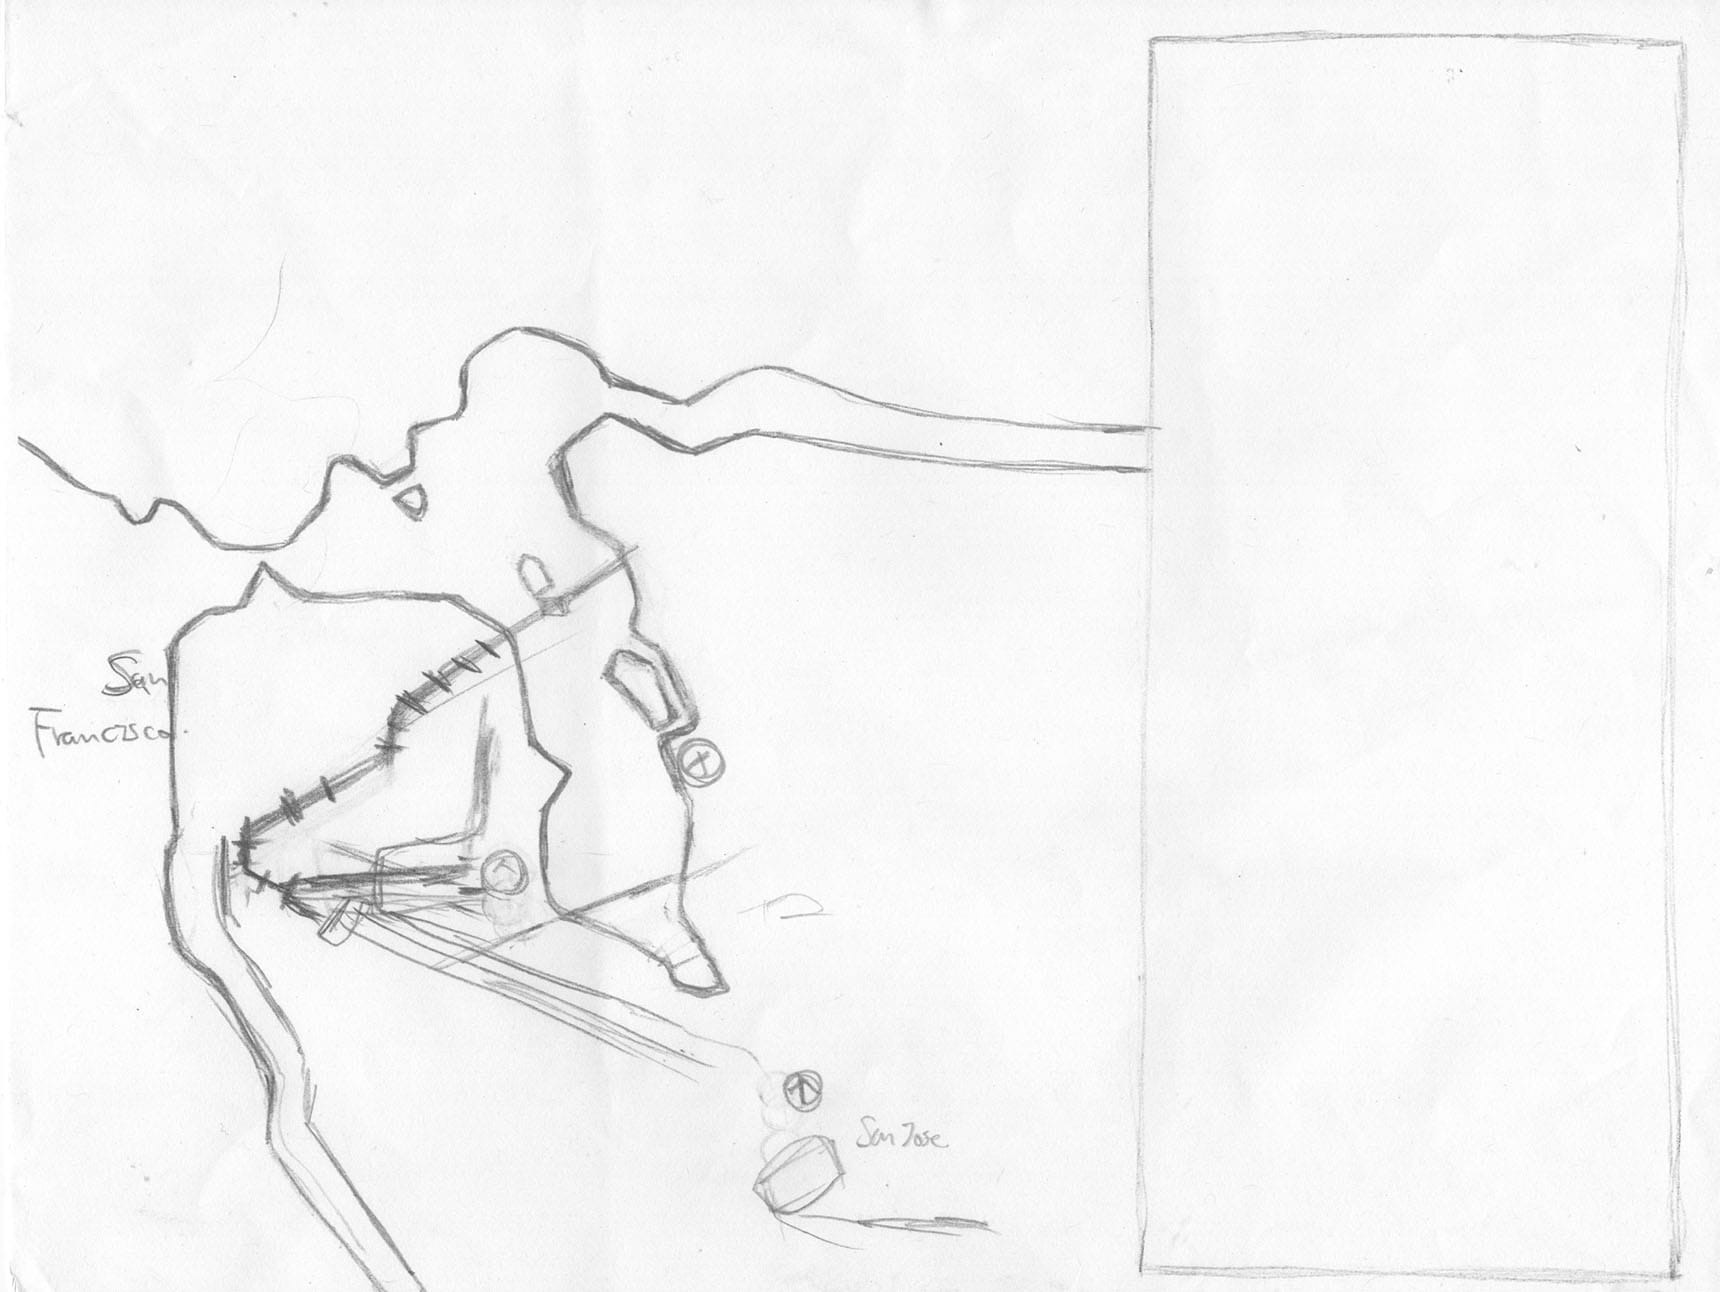
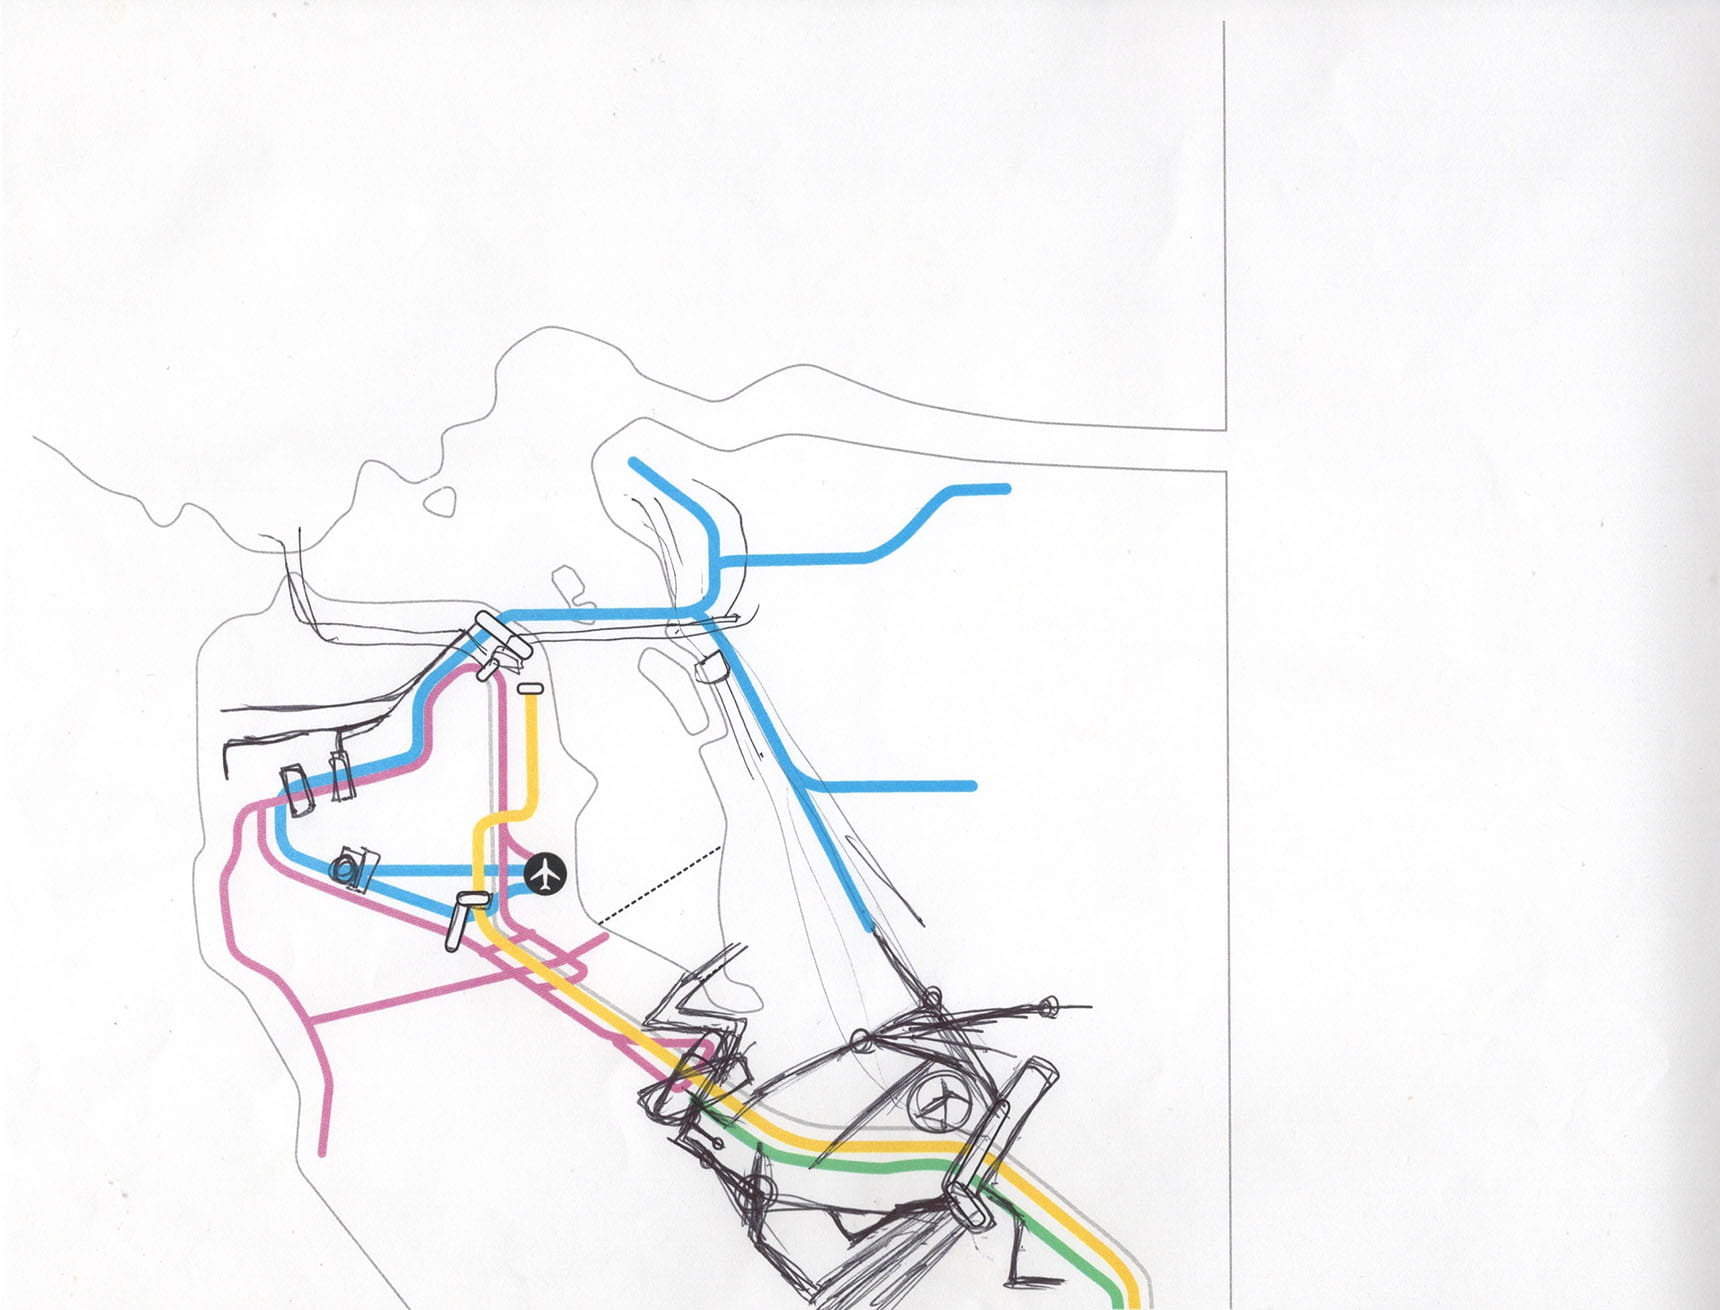
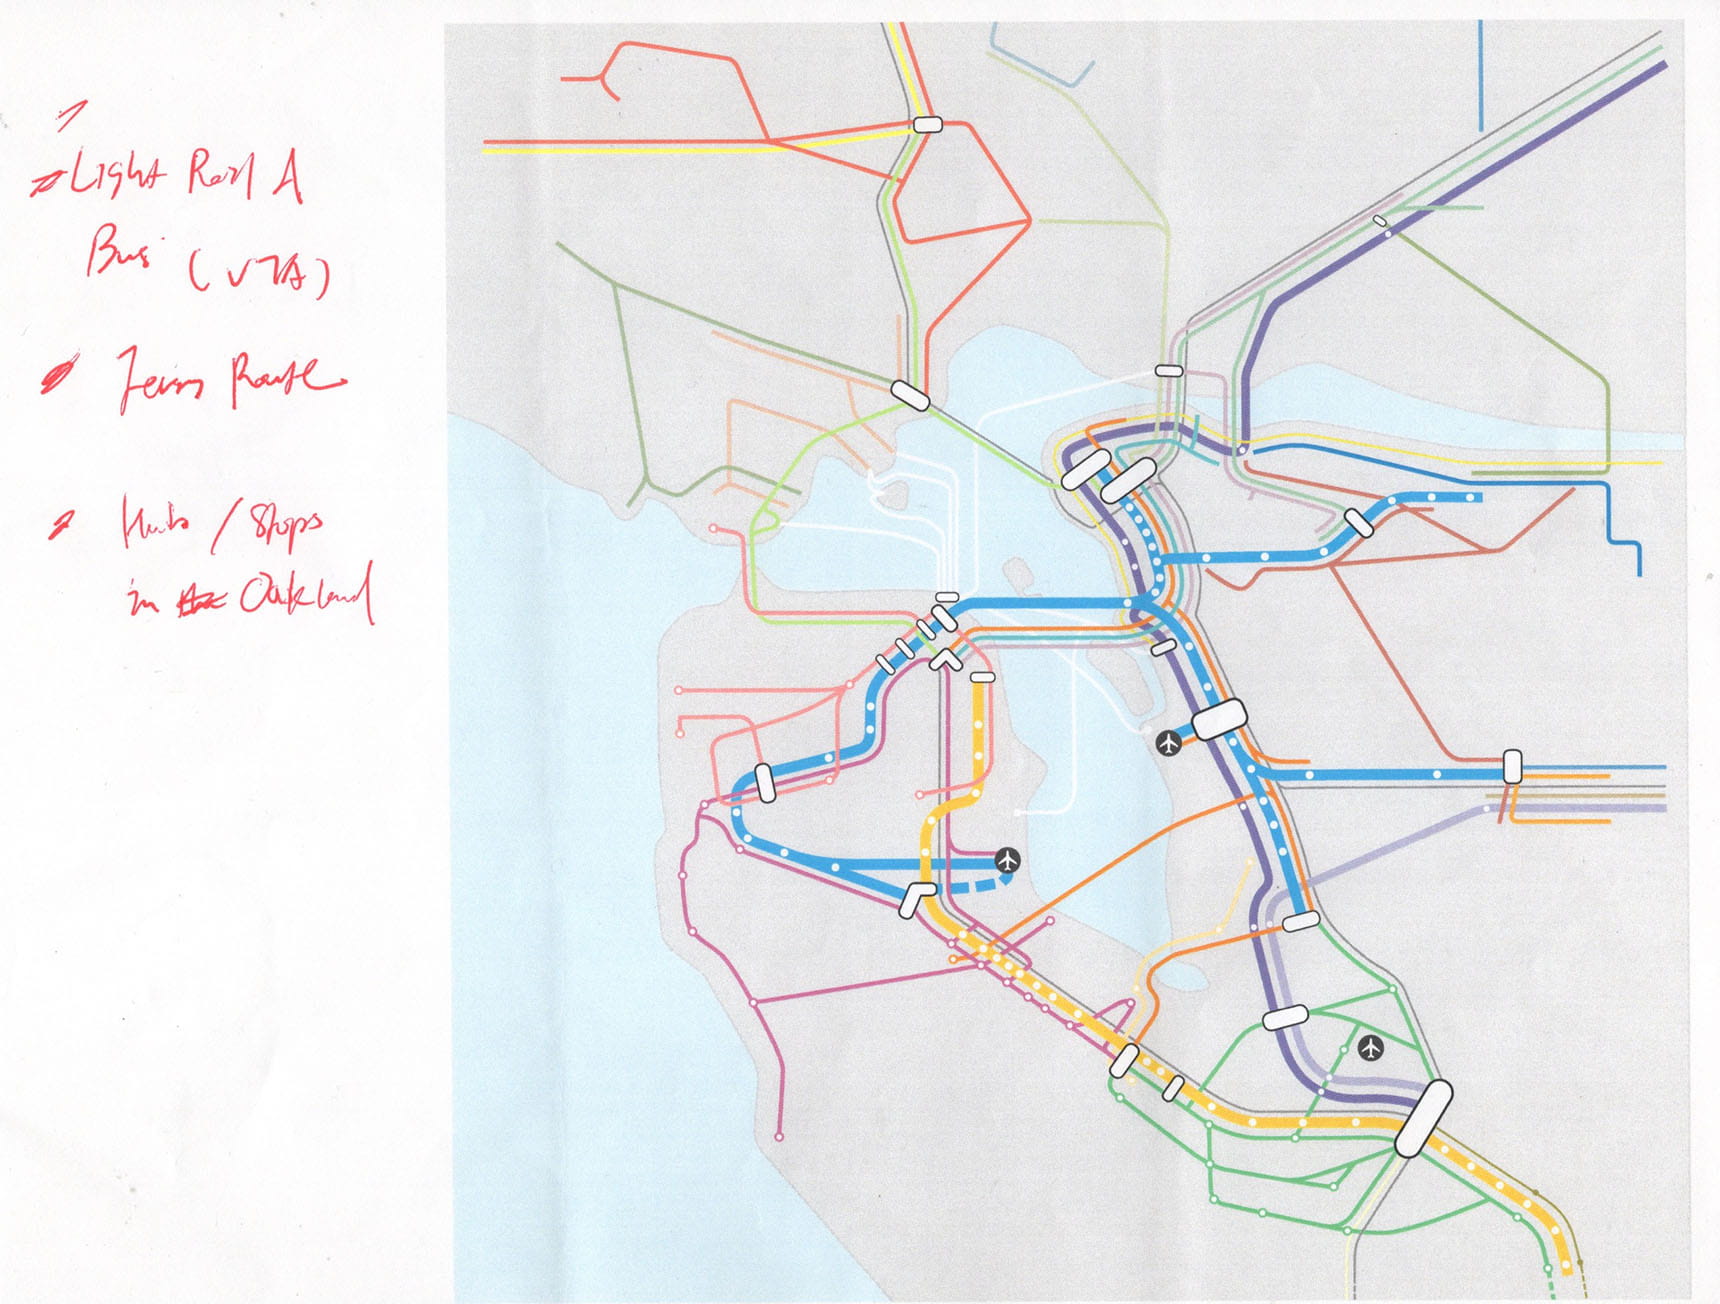
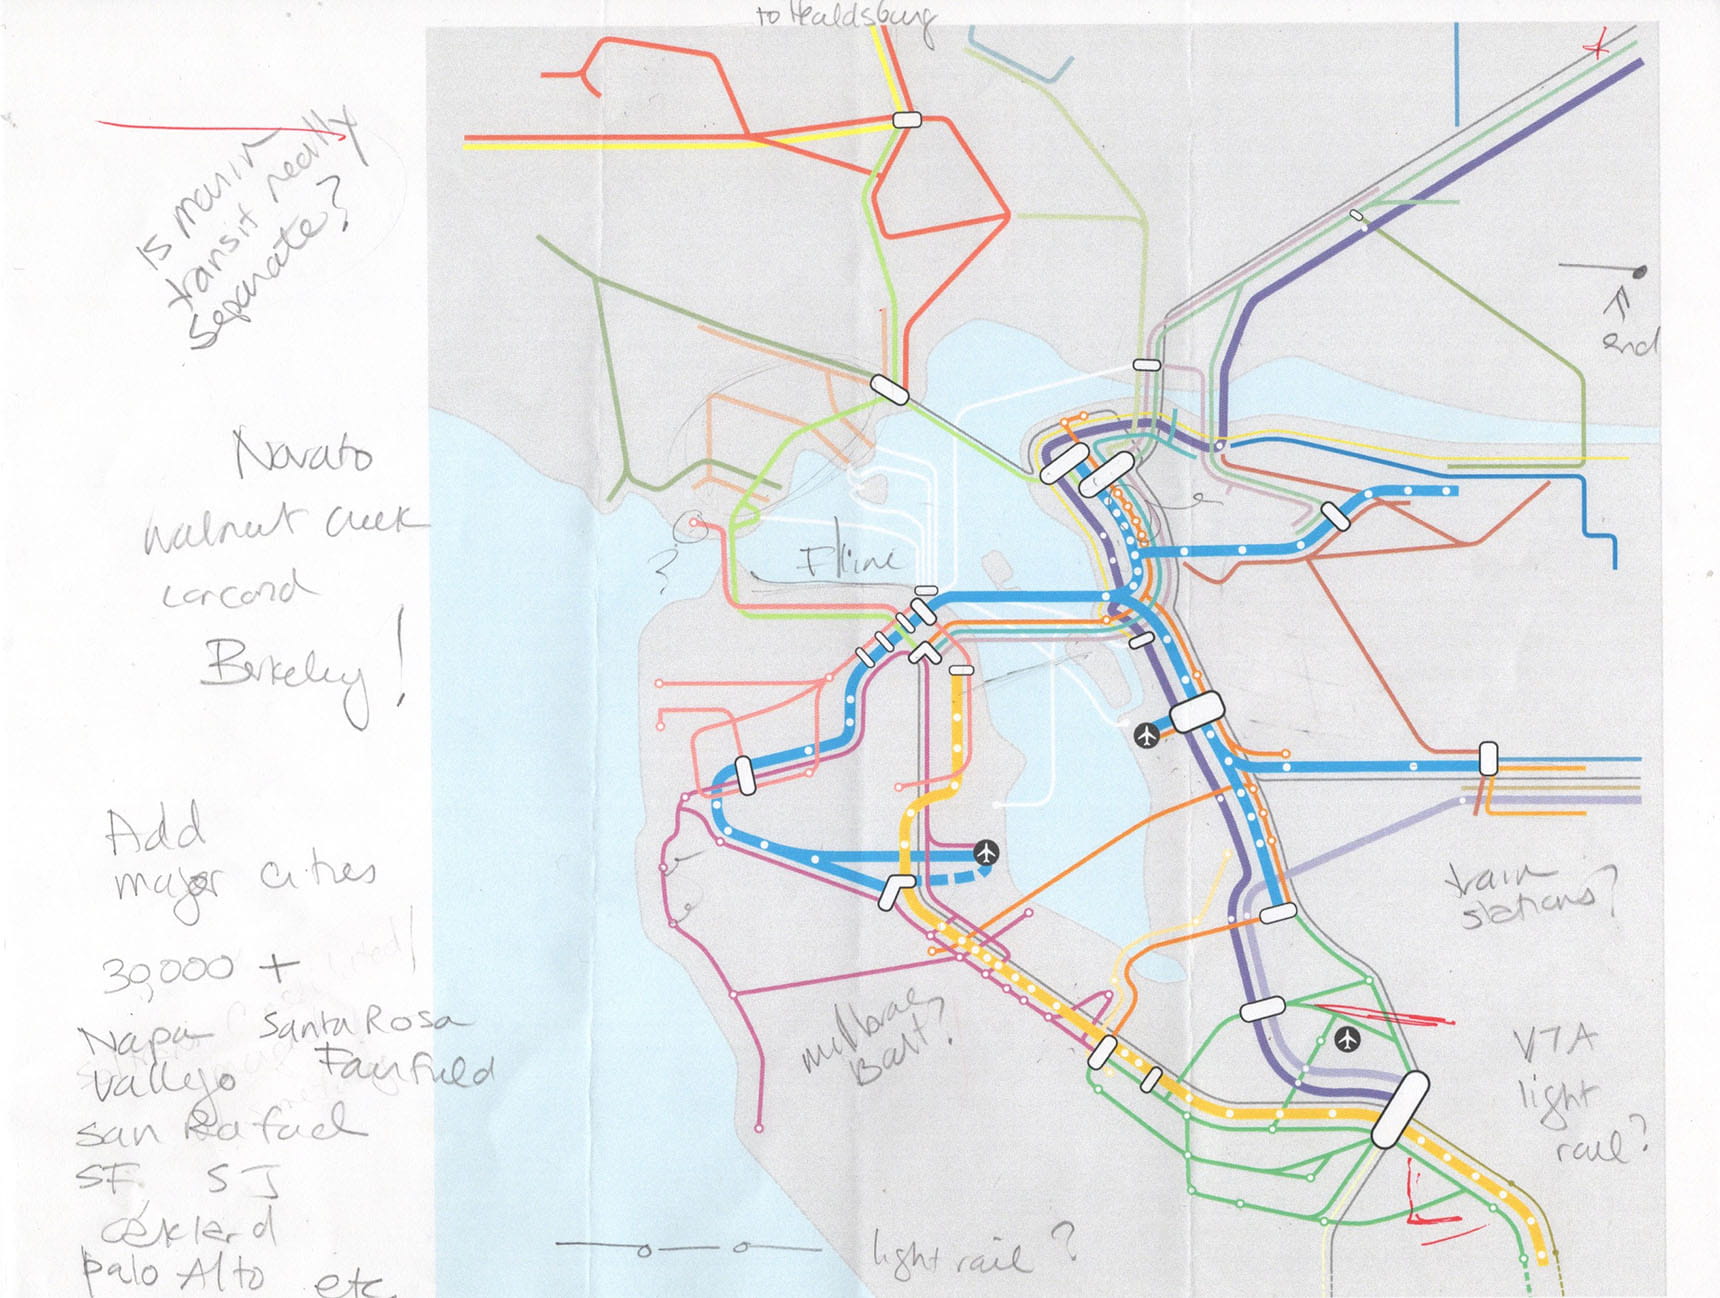
Transit Diagram
This is the project to redesign the transit diagram to promote transportation in the San Francisco Bay Area by showing its network and connectivity. The diagram was designed by extracting data from the old transit diagram and updating it discussing with internal planners and local agencies.
Illustrator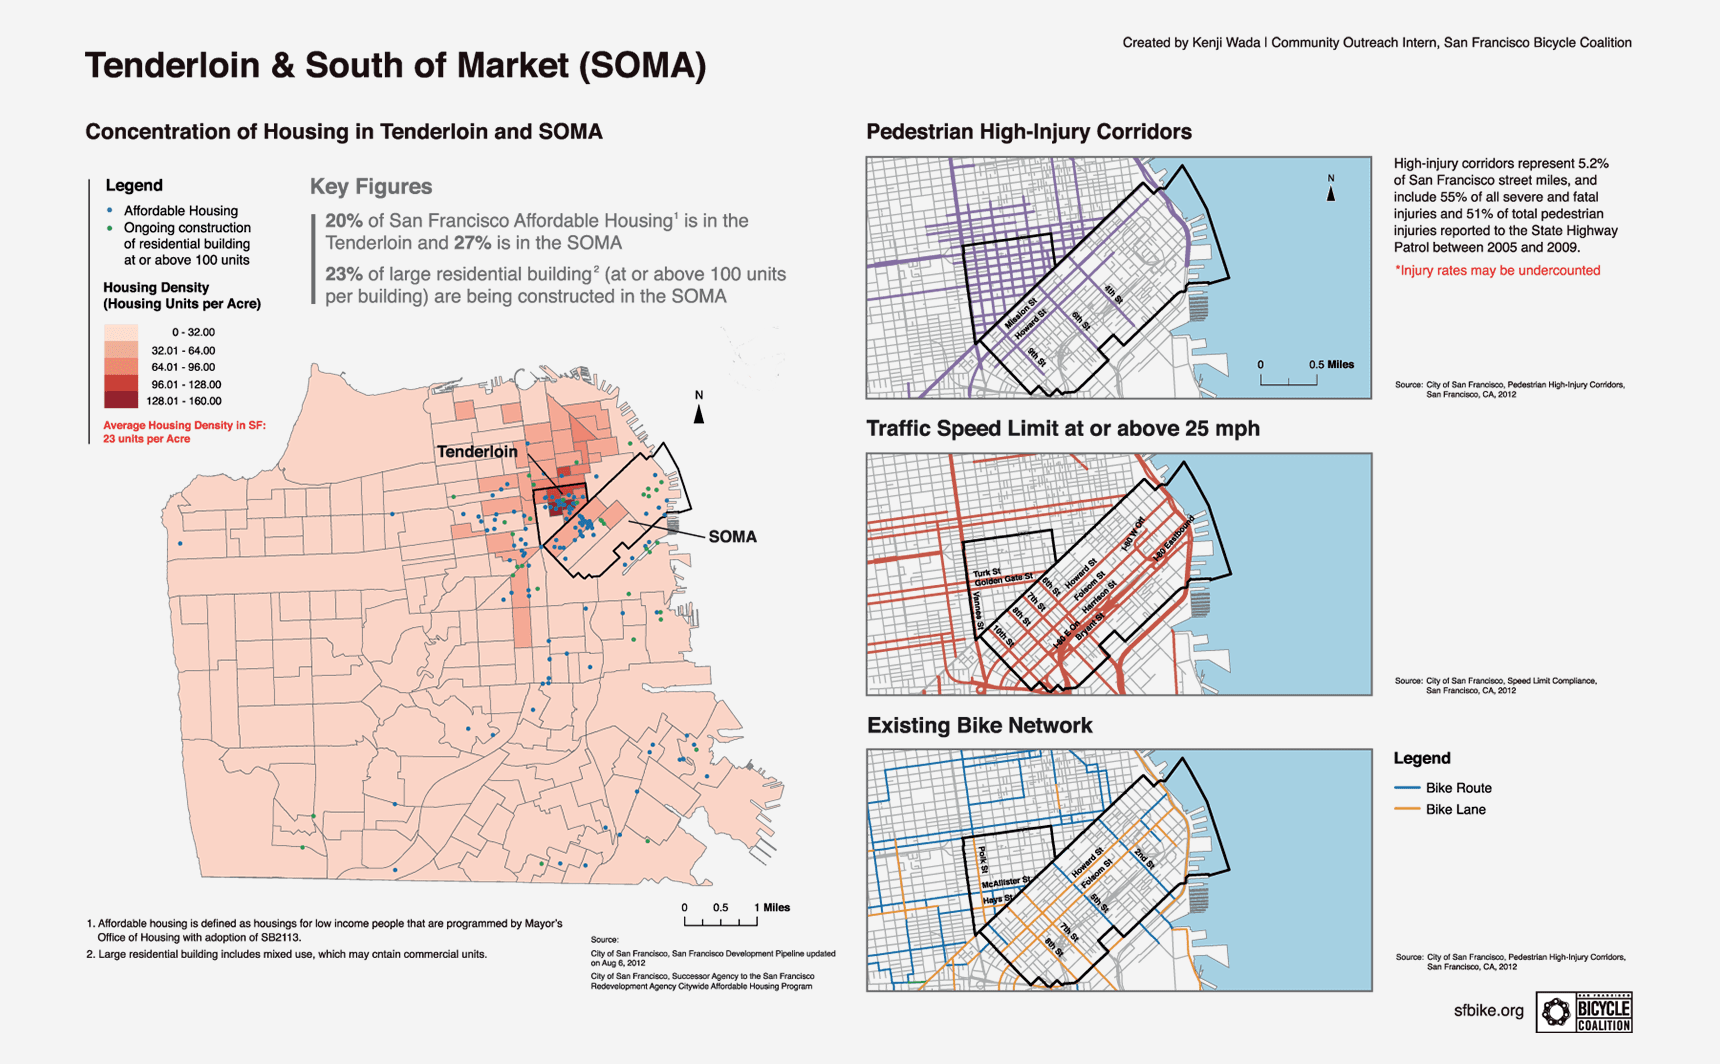
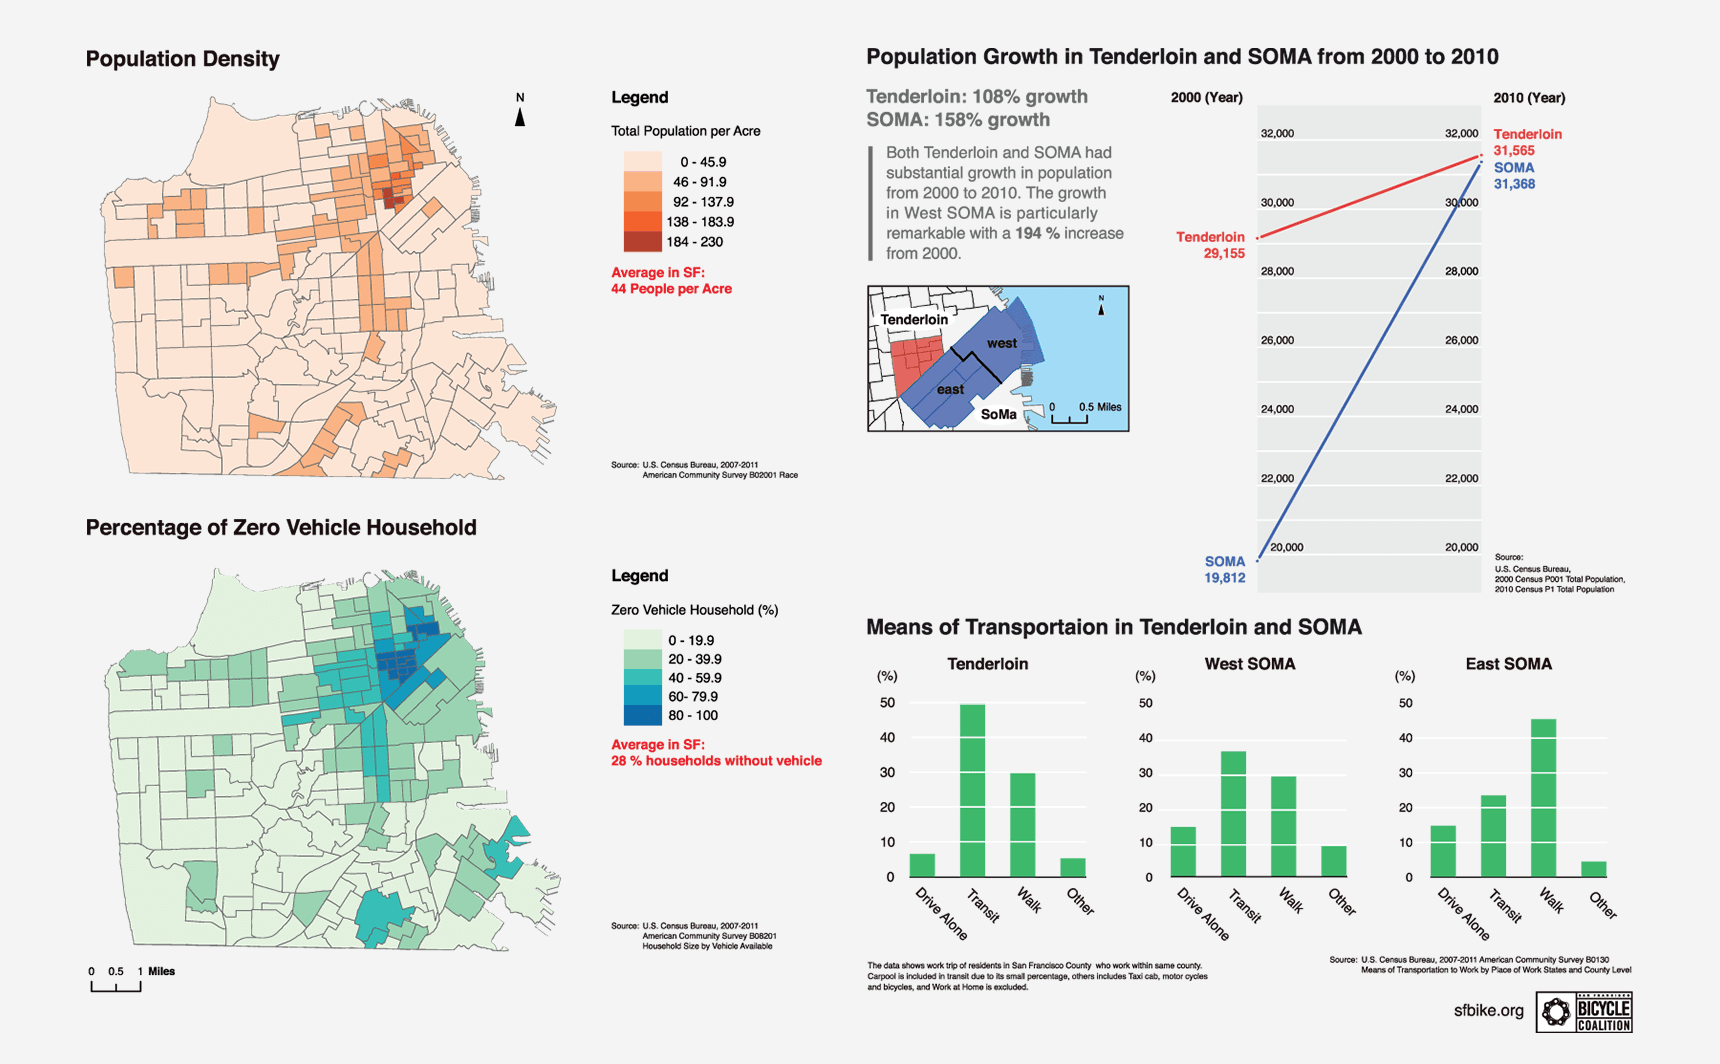
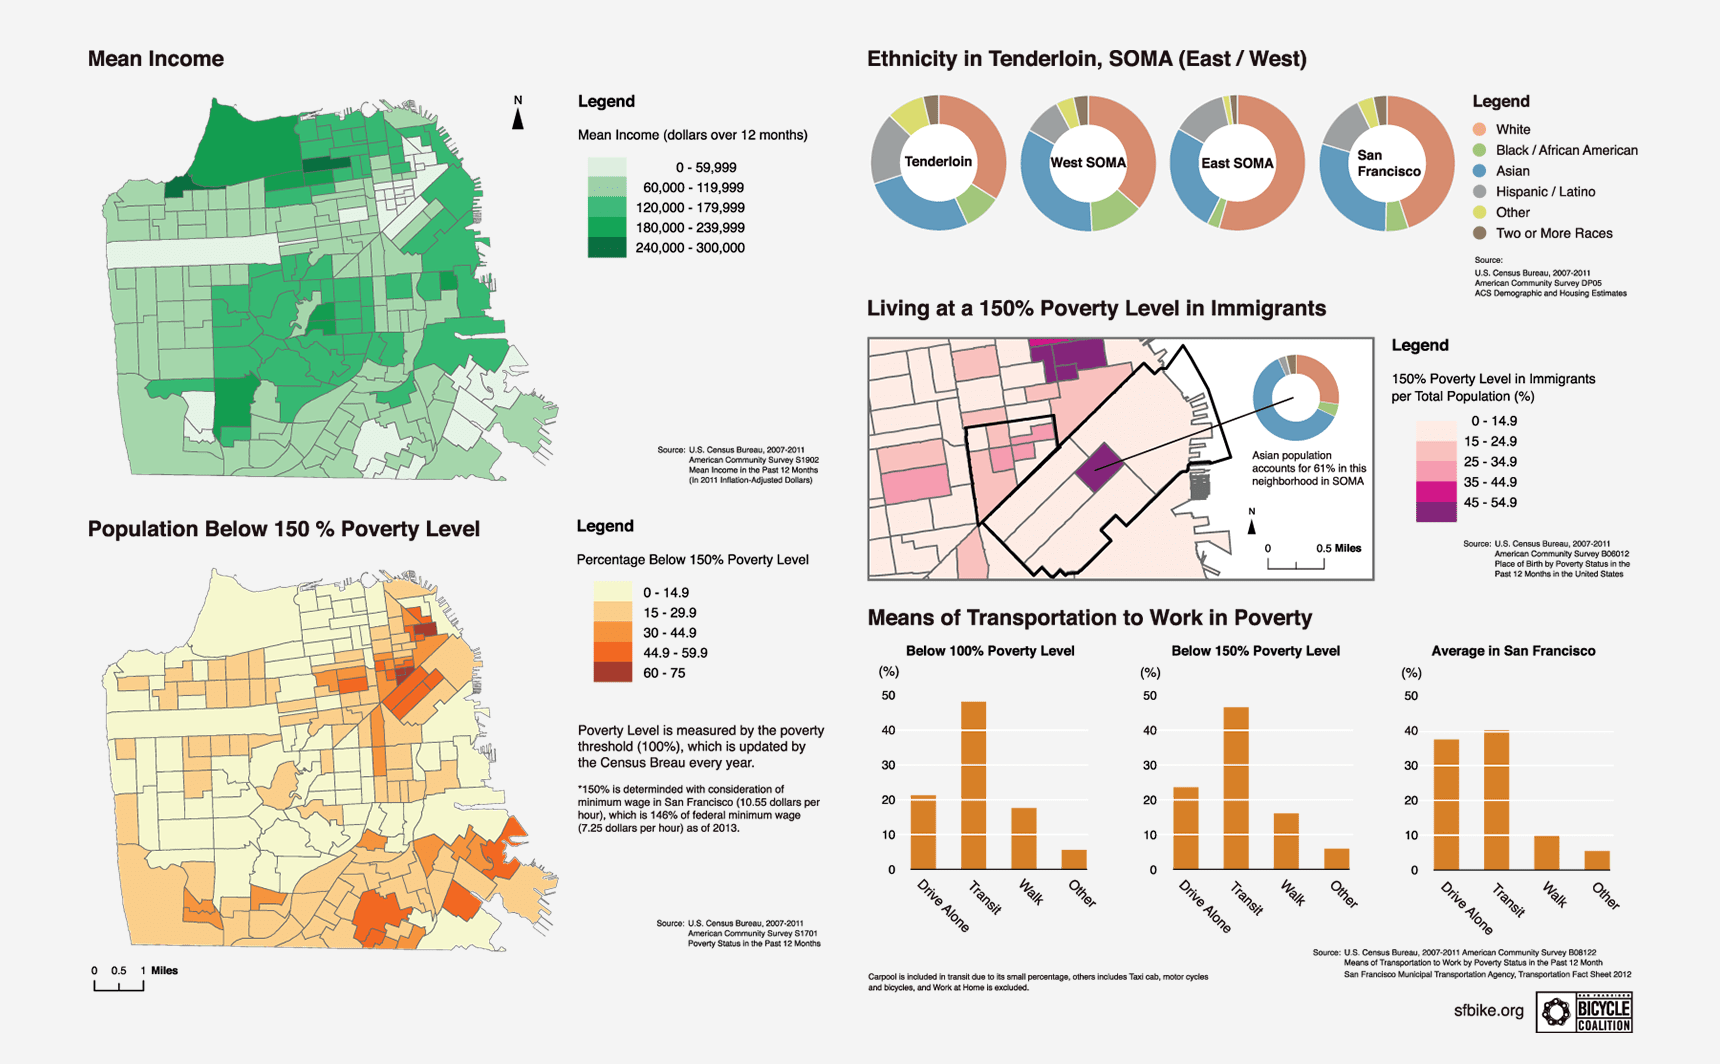
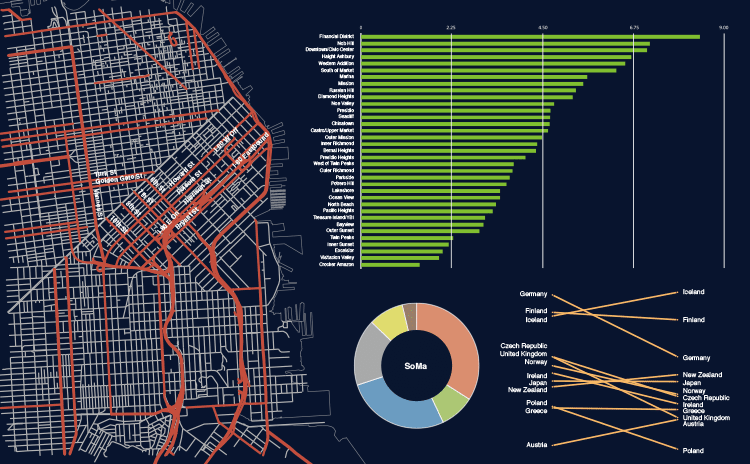
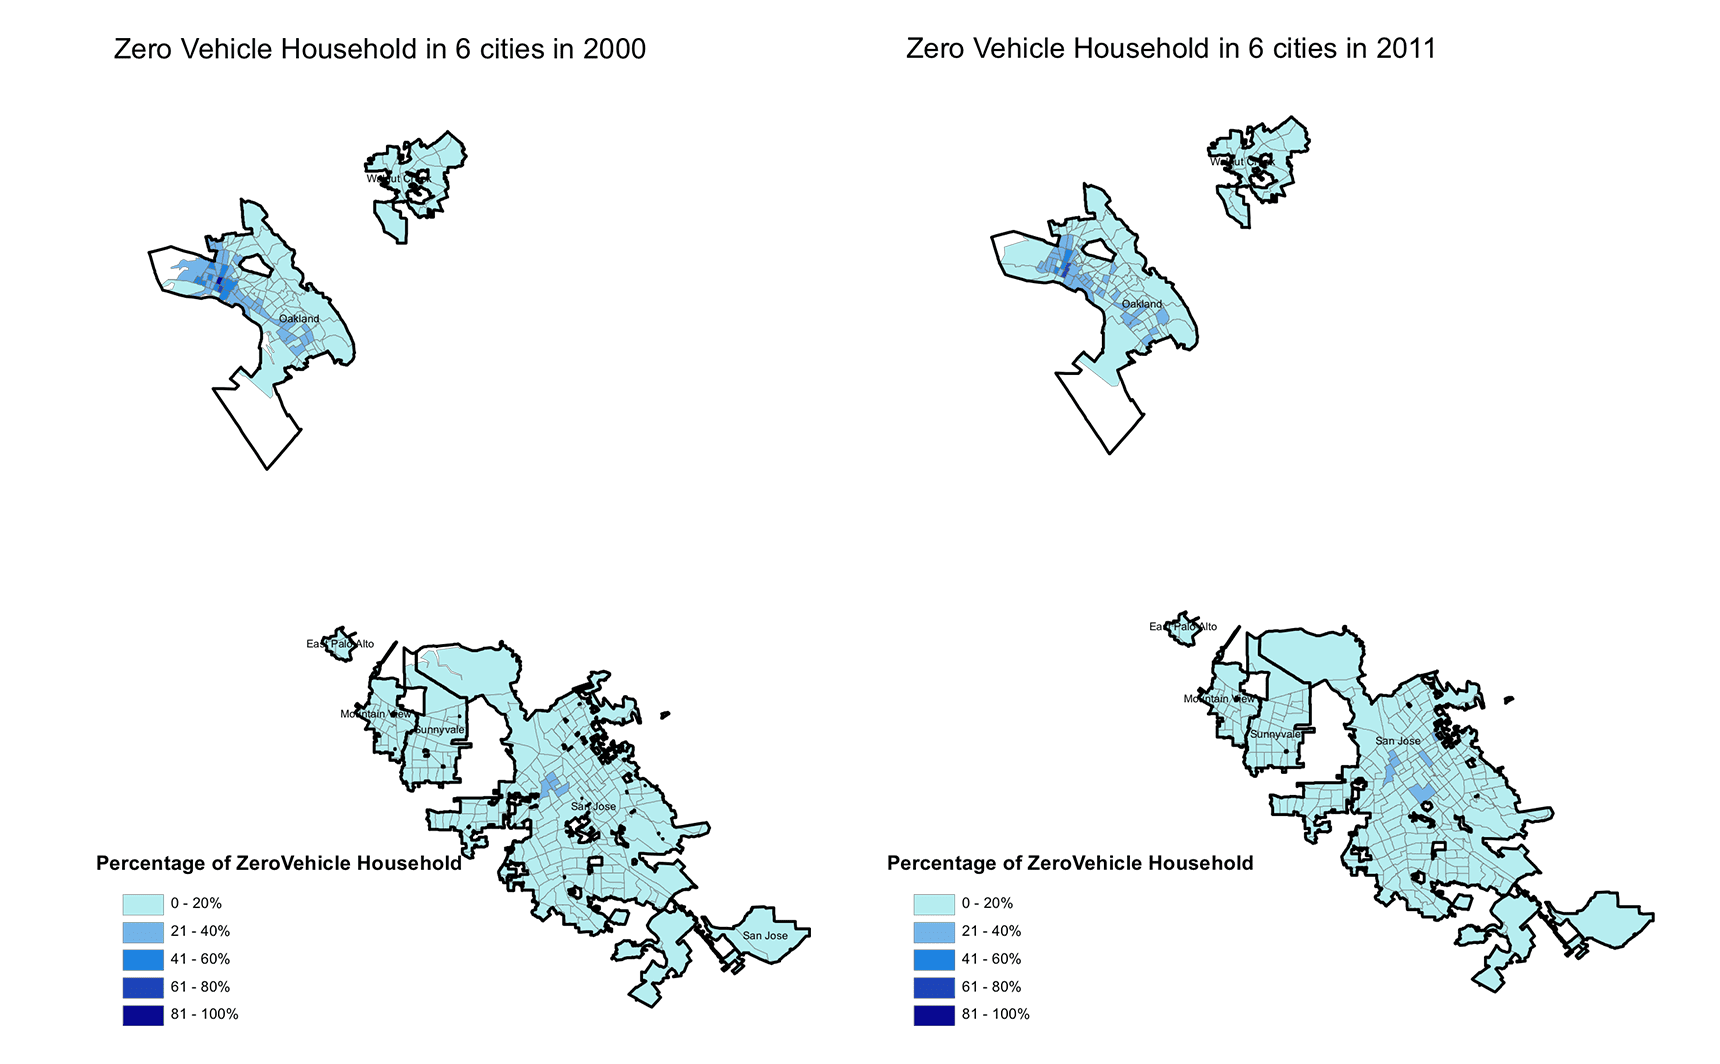
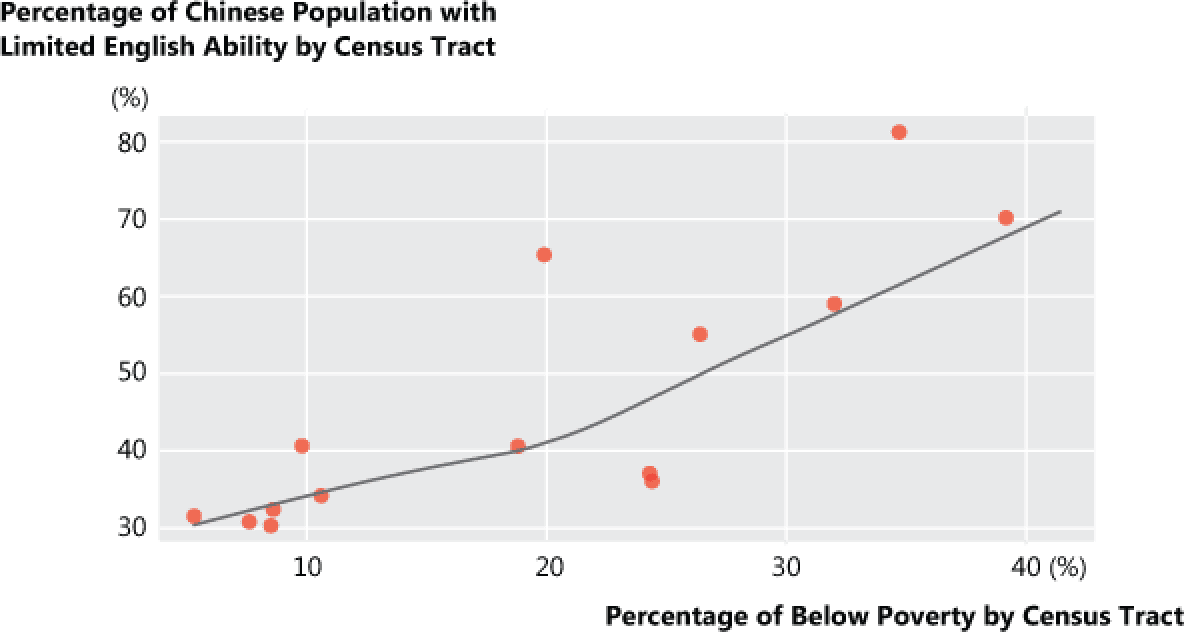
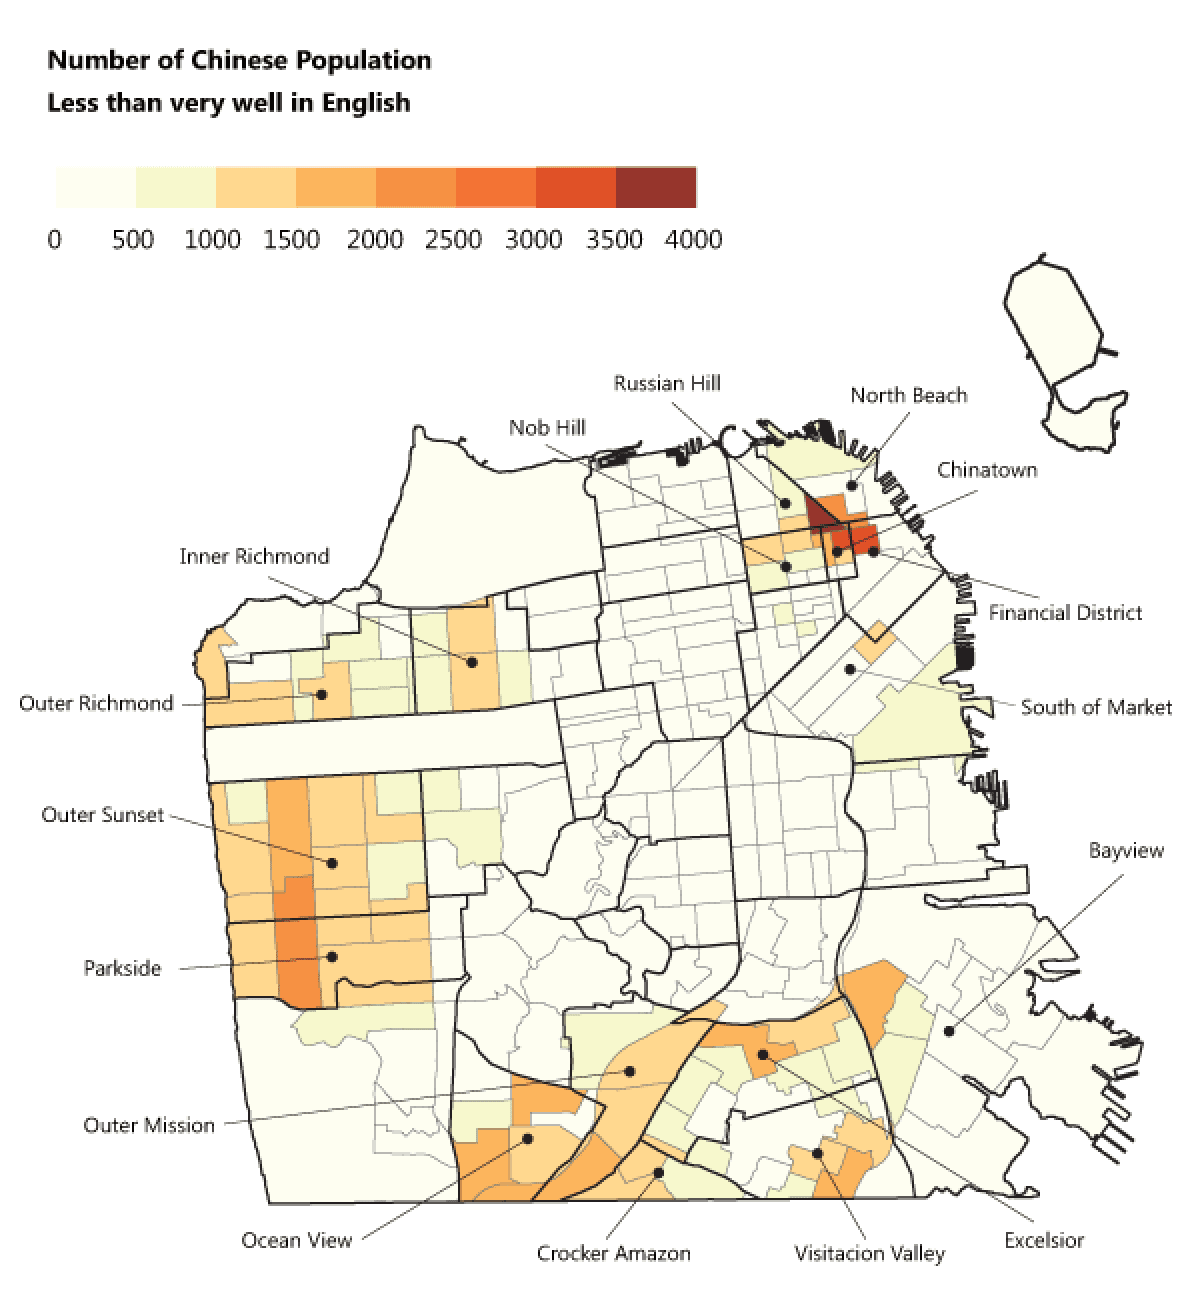
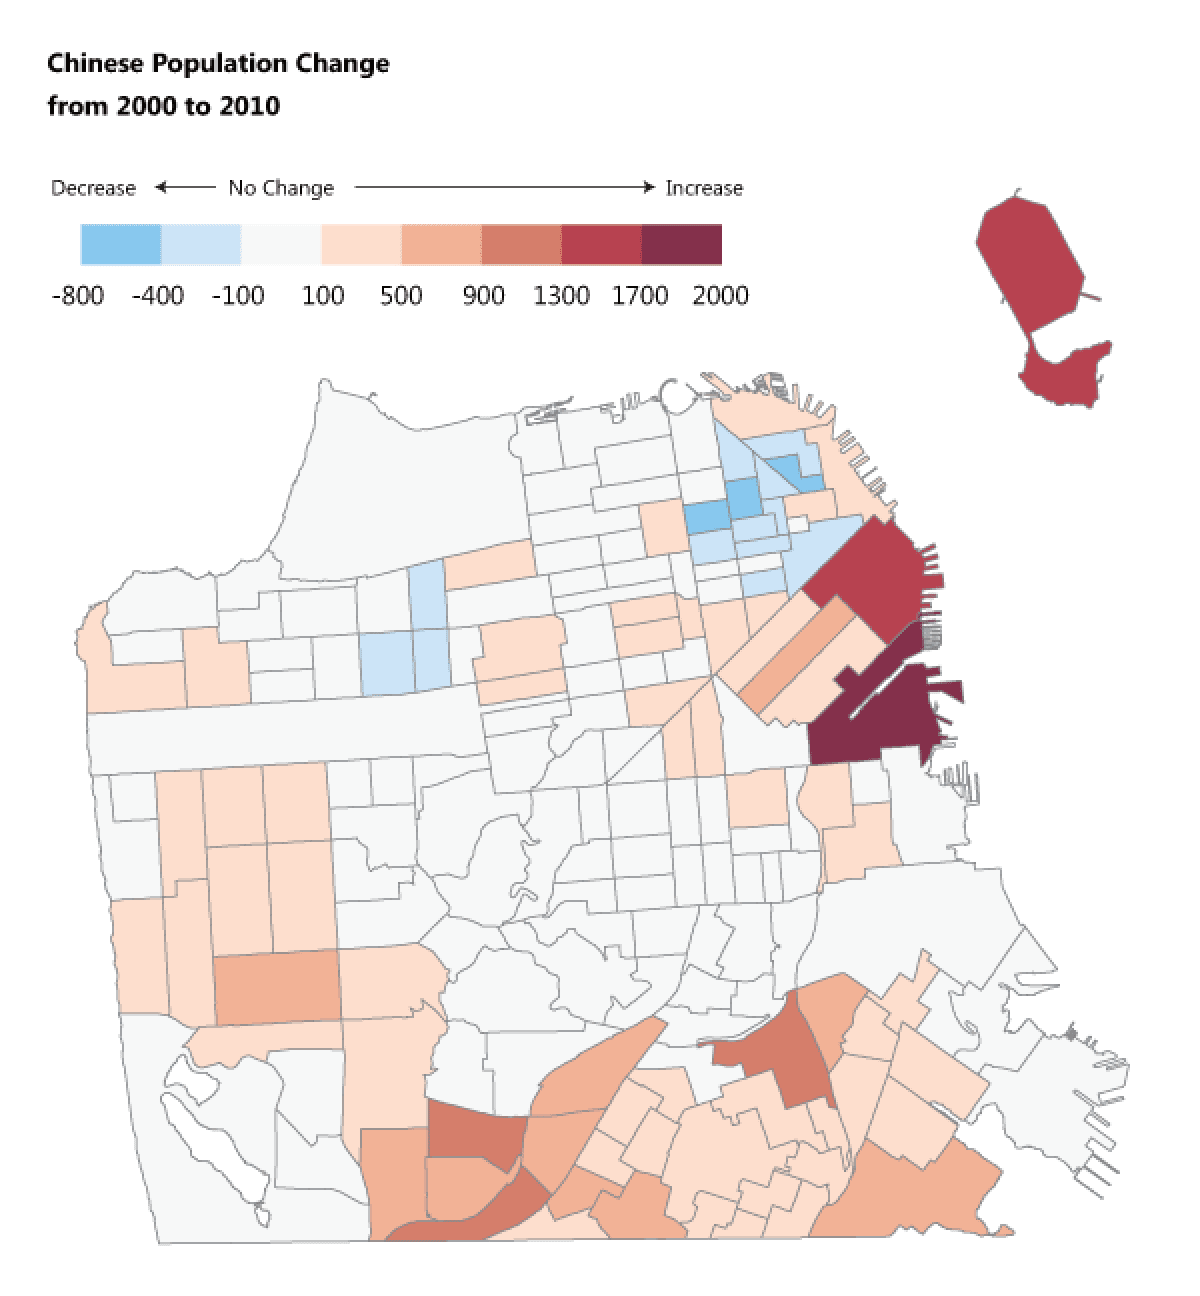
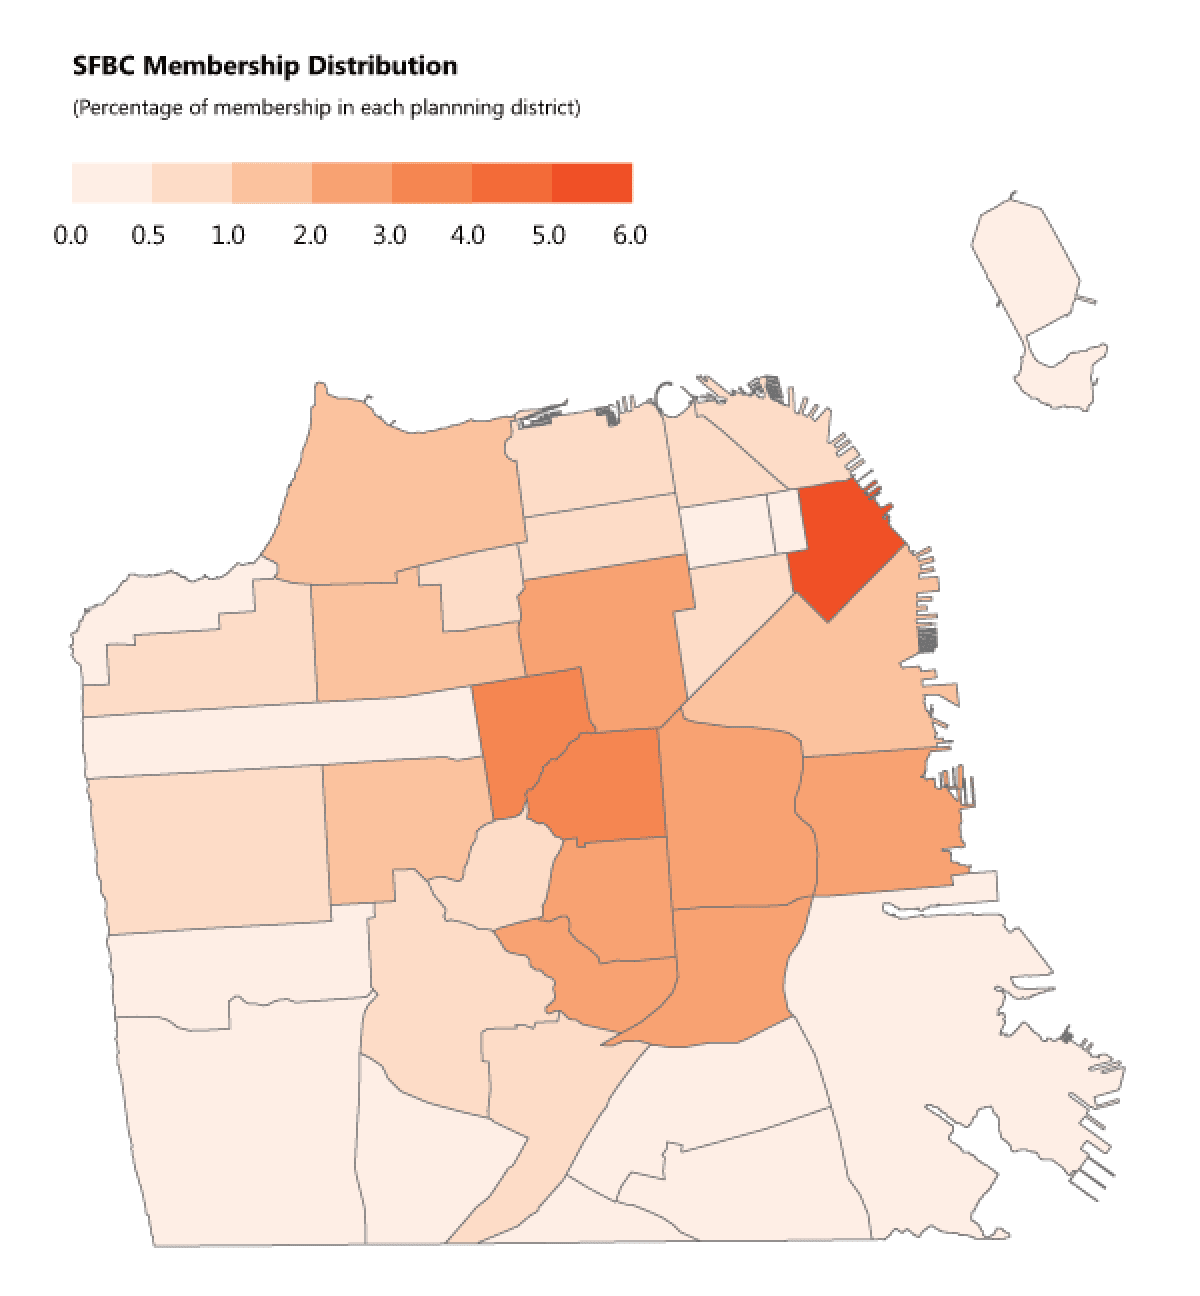
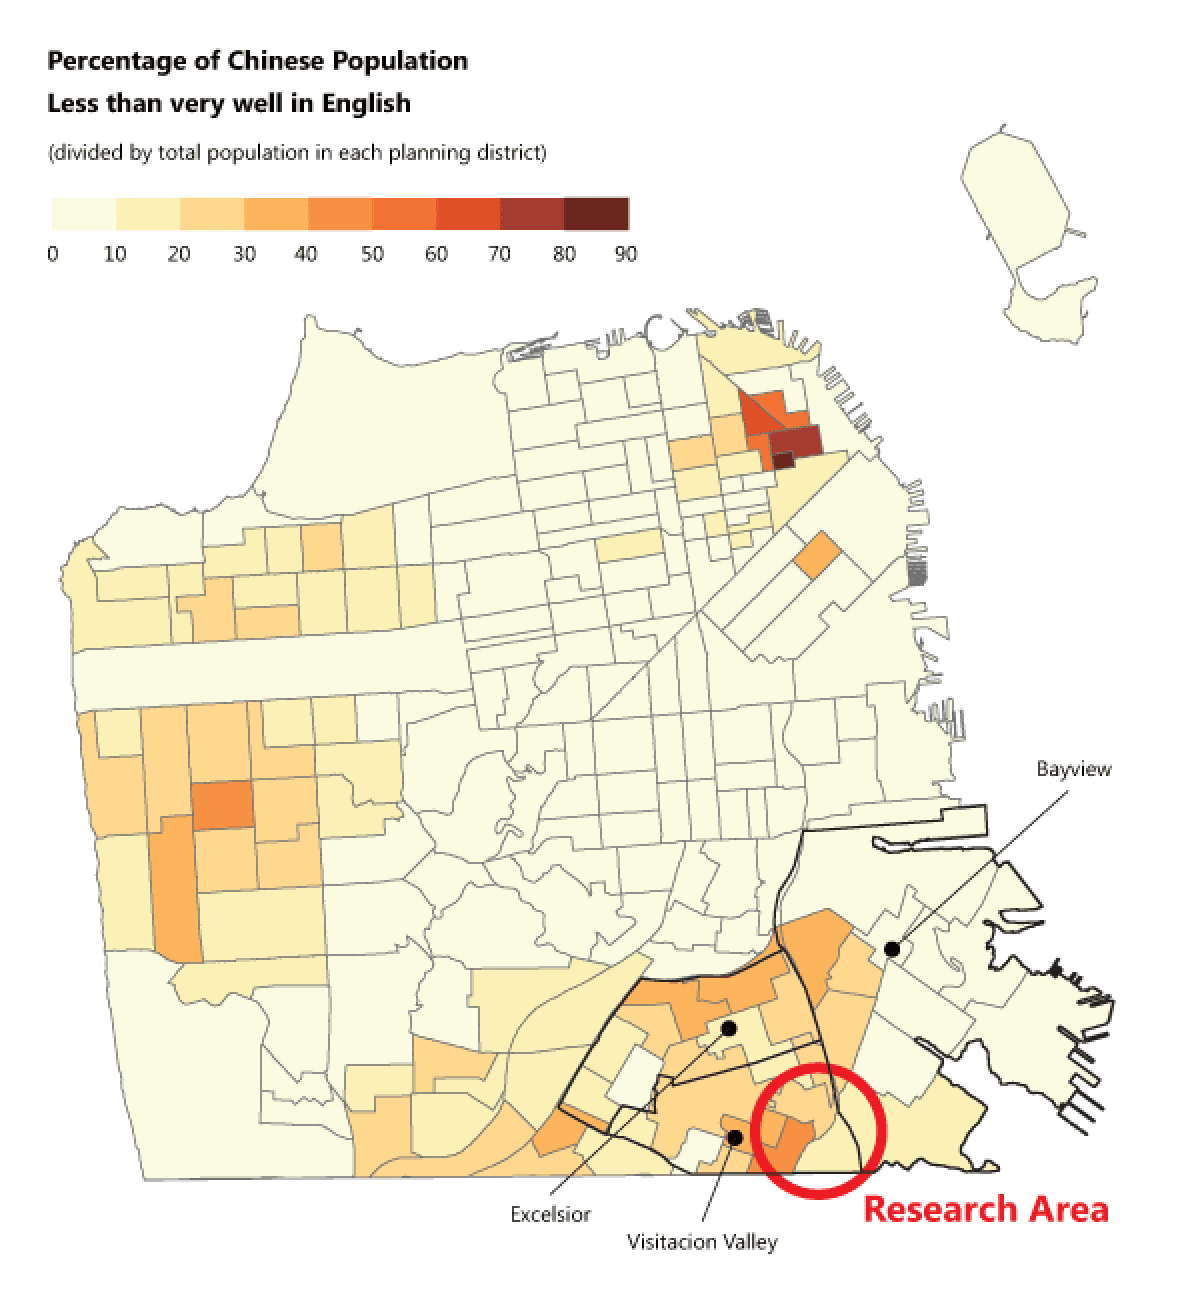
Tenderloin / SOMA
A Series of data visualizations about the neighborhood of Tenderloin and SoMa (South of Market) was designed to communicate the necessity of improvements there to various audiences including citizens. Original data visualizations were created by using ArcGIS and R. Then, Illustrator was used to cleaning up and organize all visualizations.
Illustrator · ArcGIS · R · Photoshop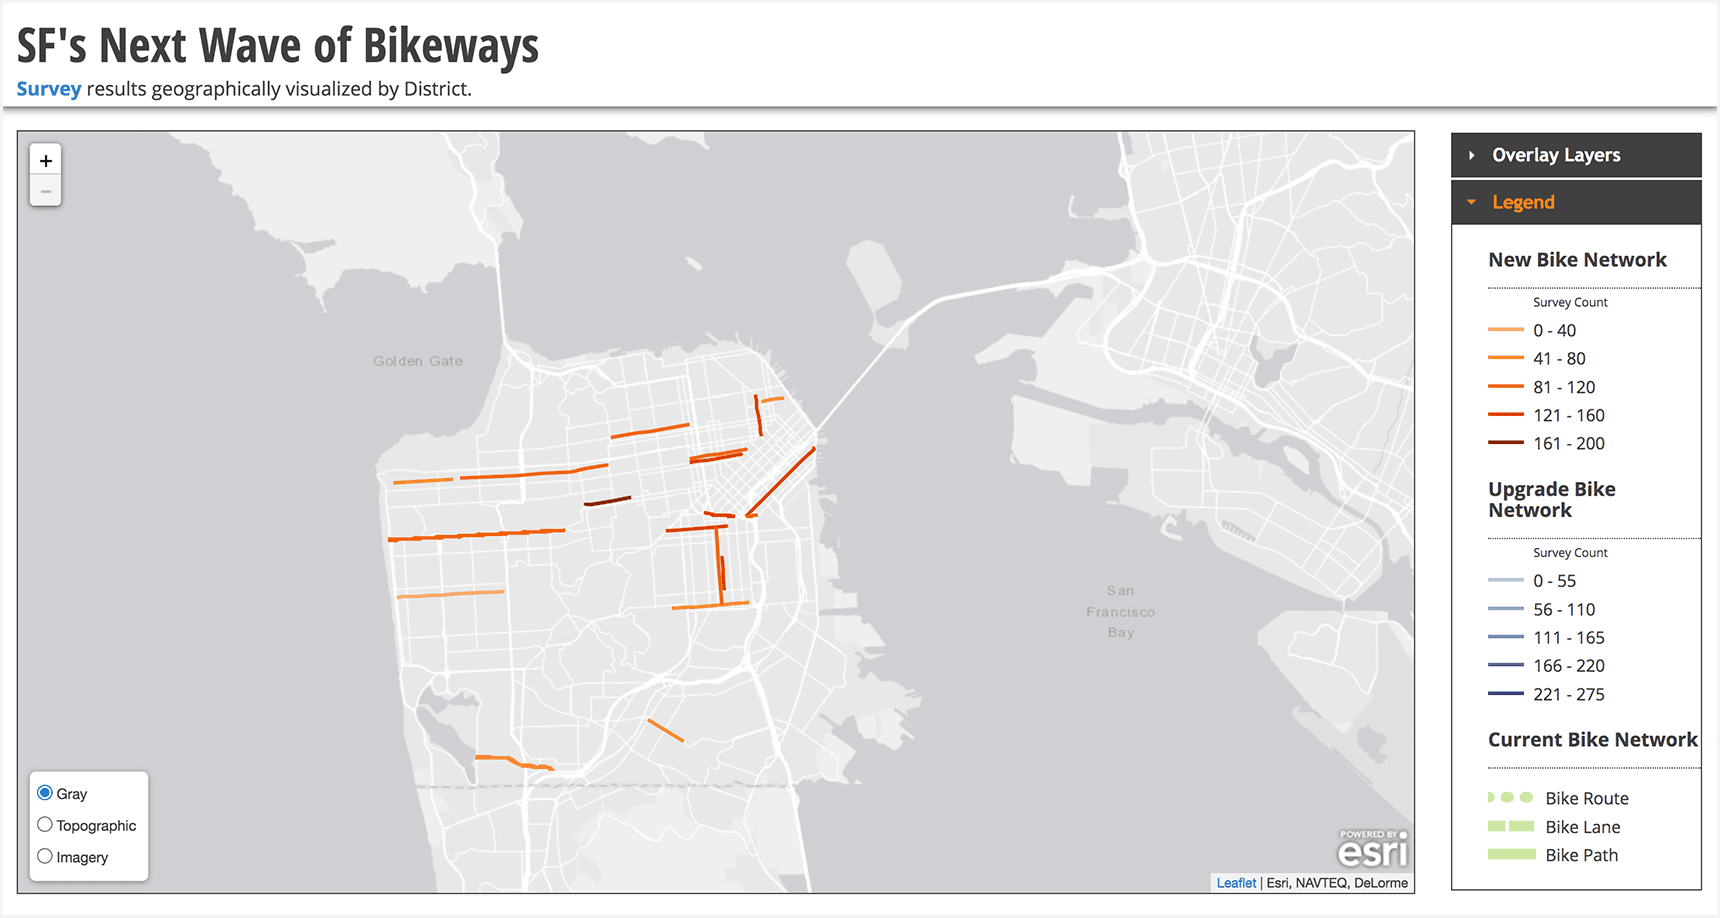
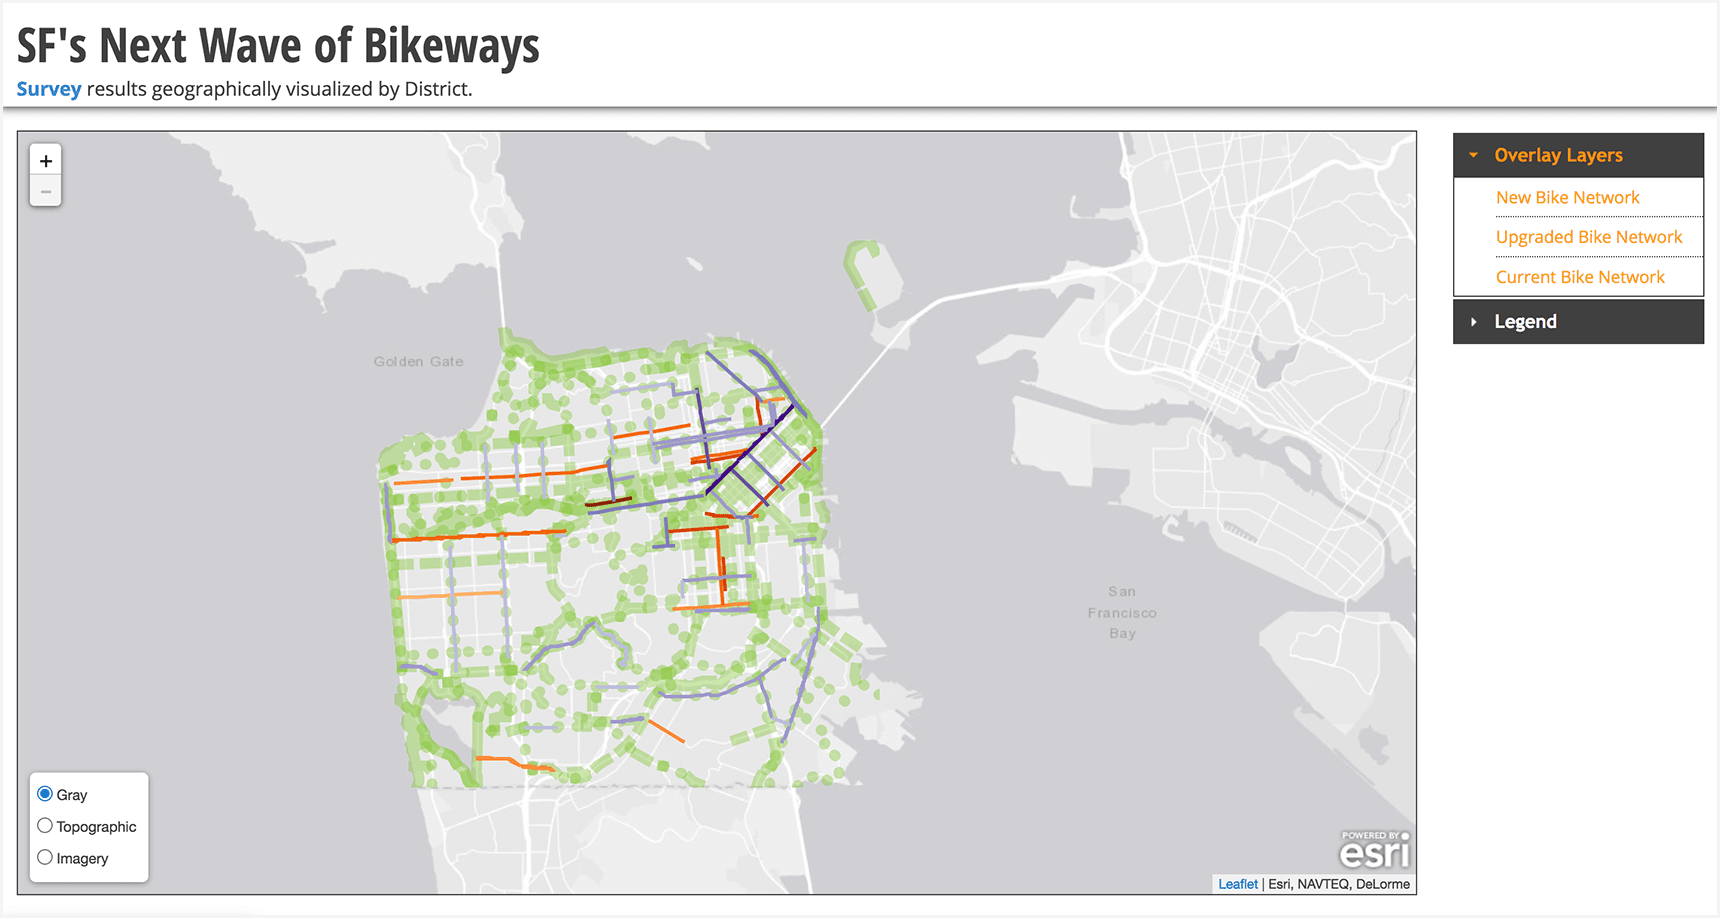
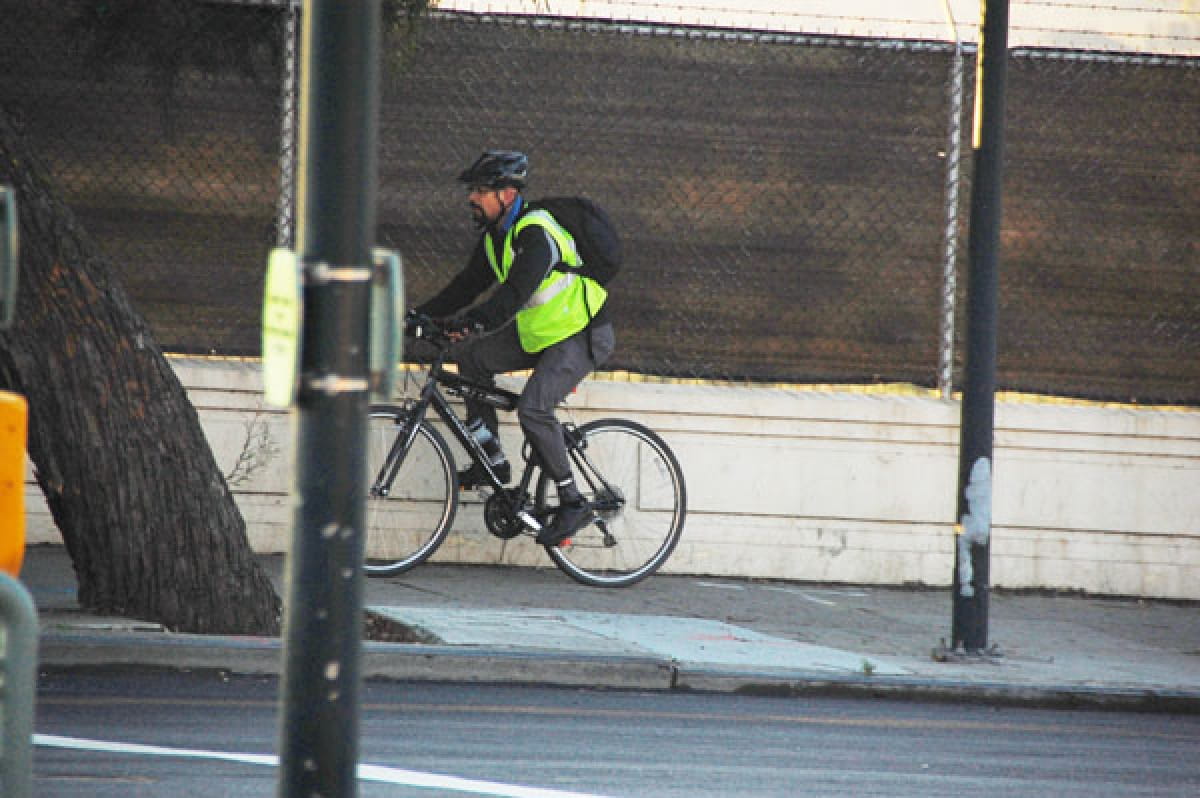
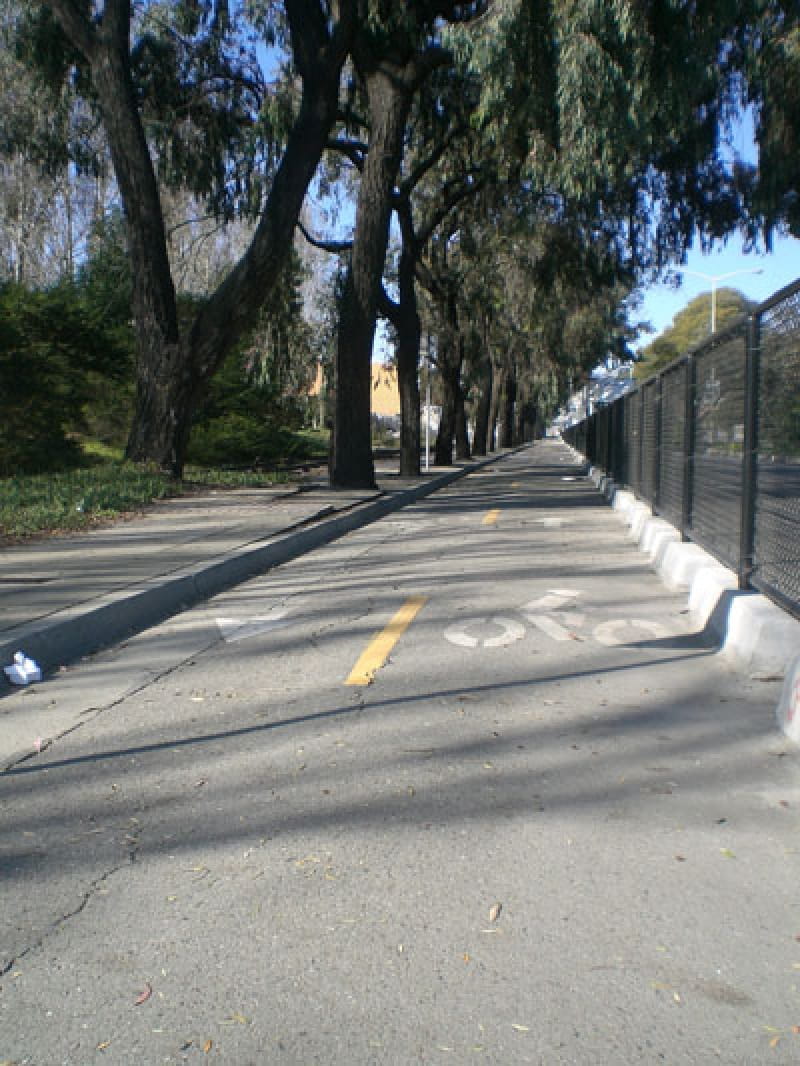
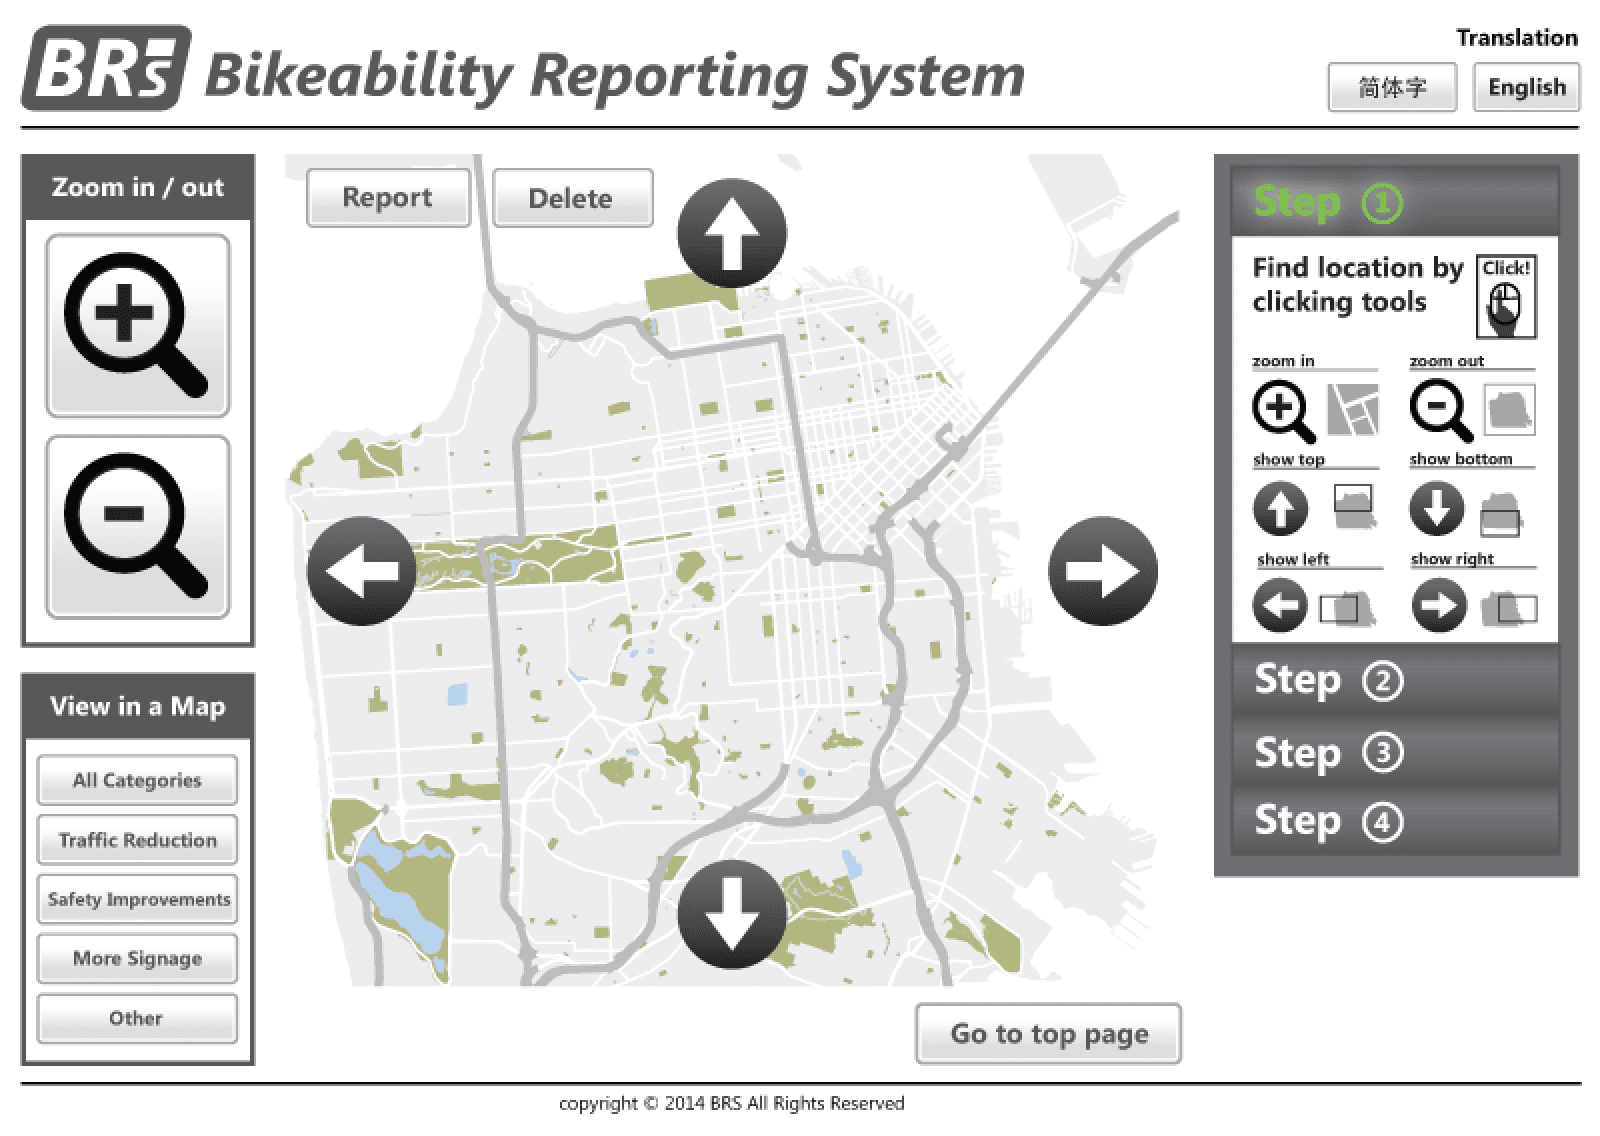
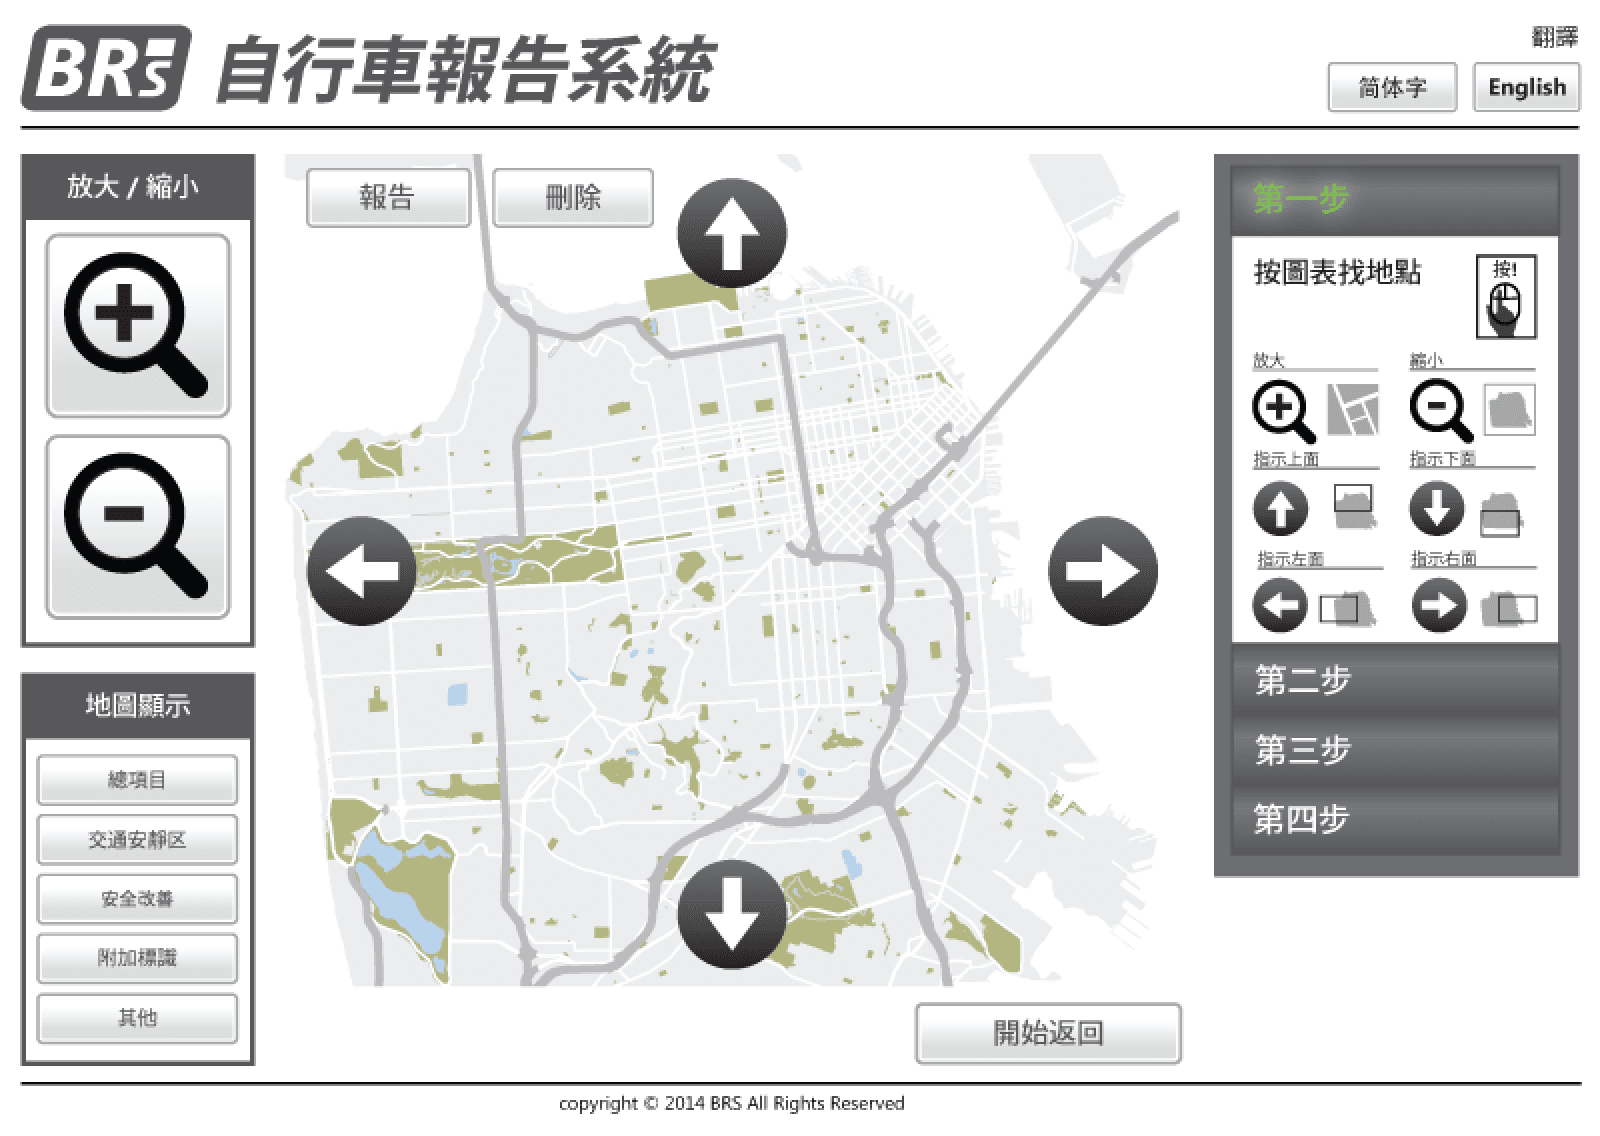
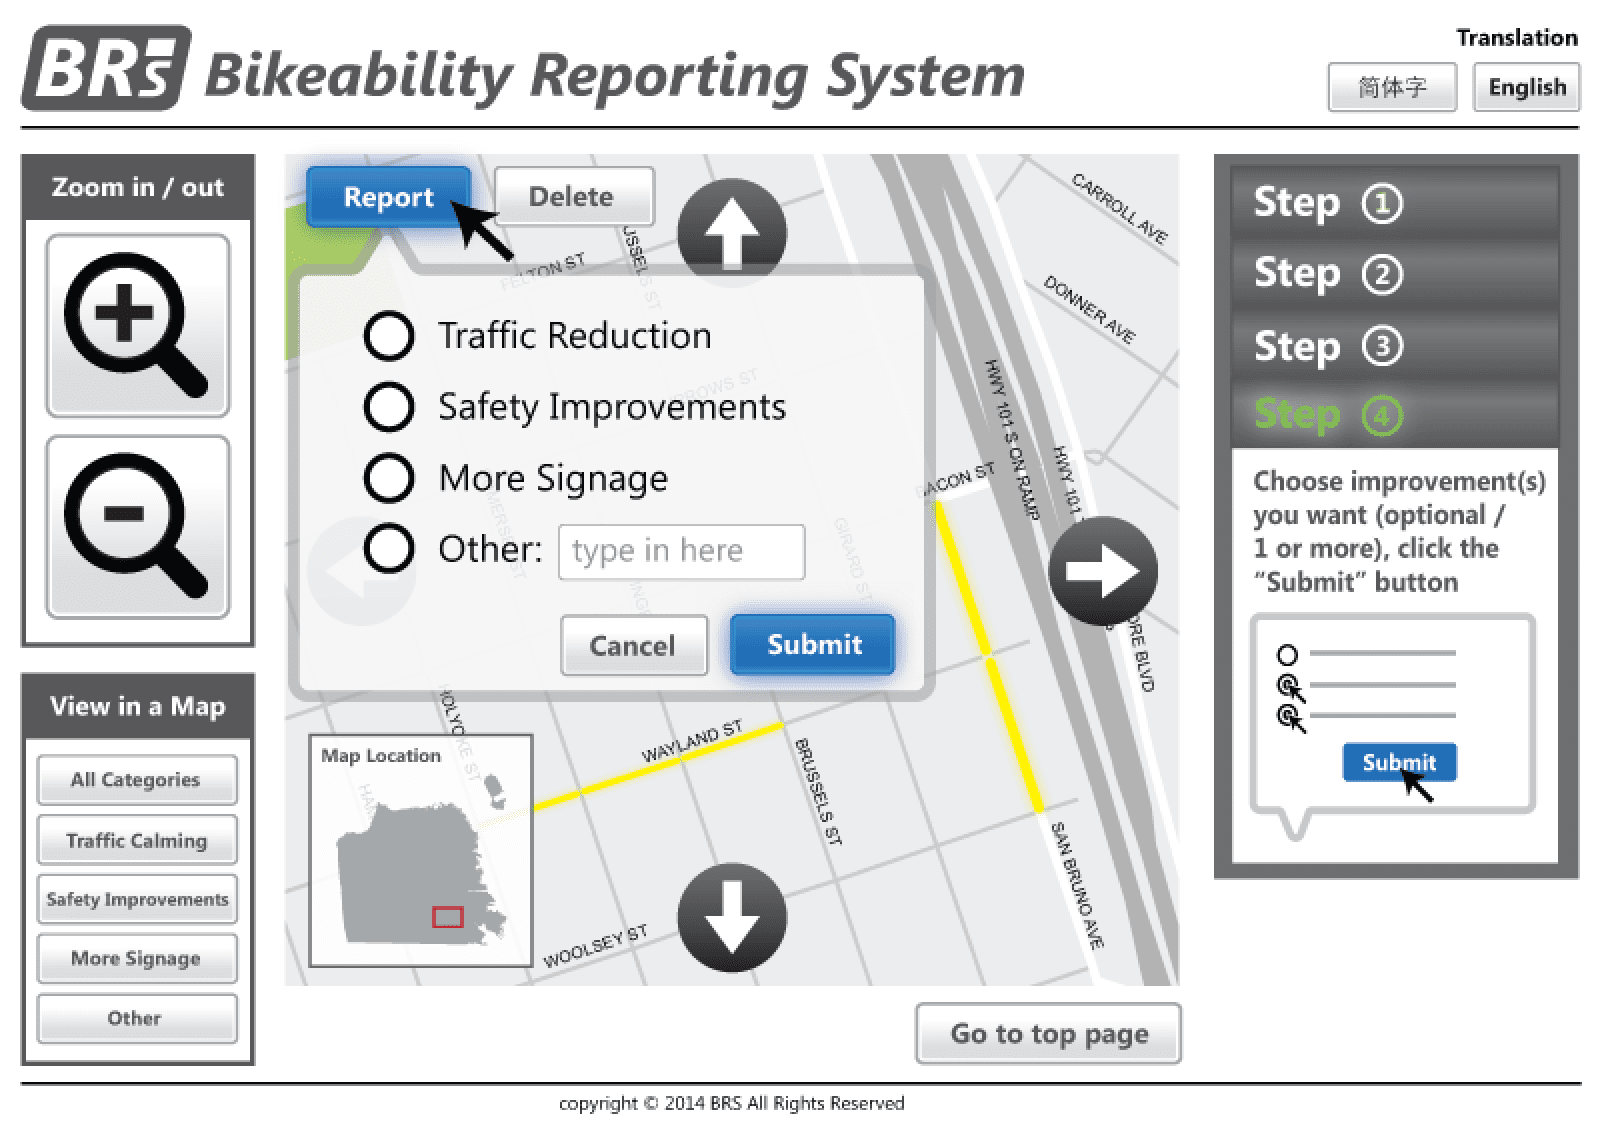
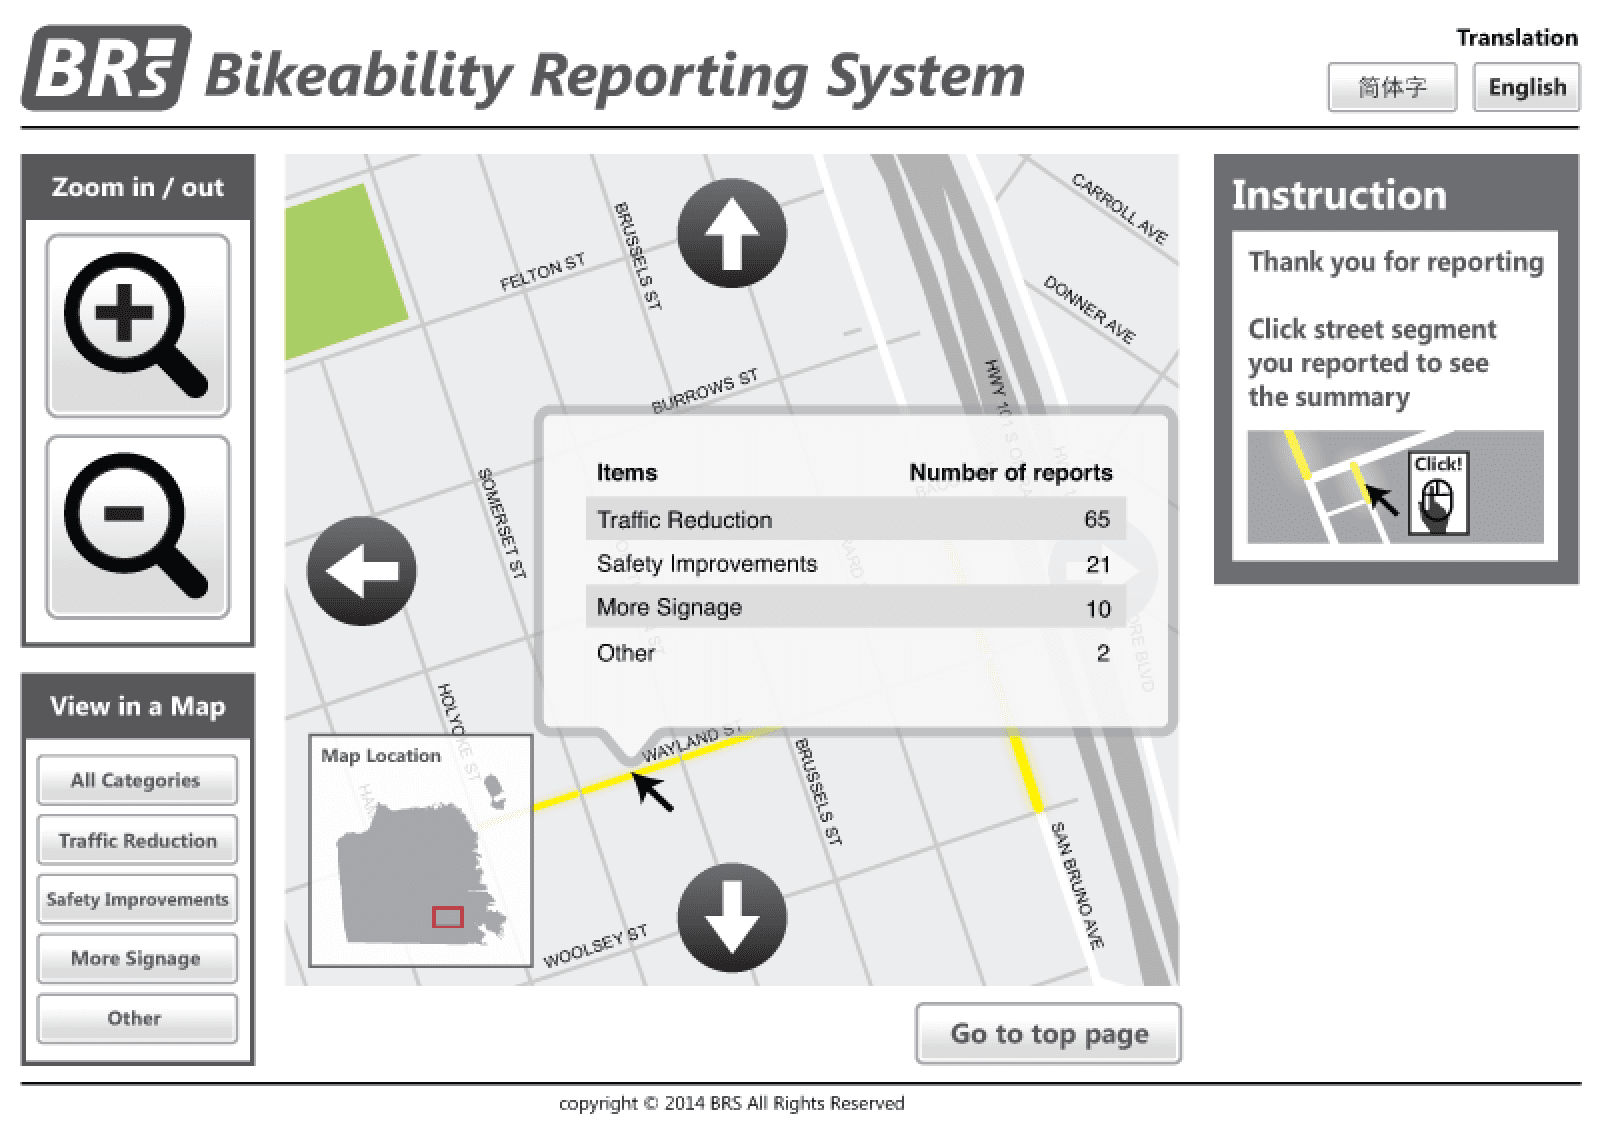
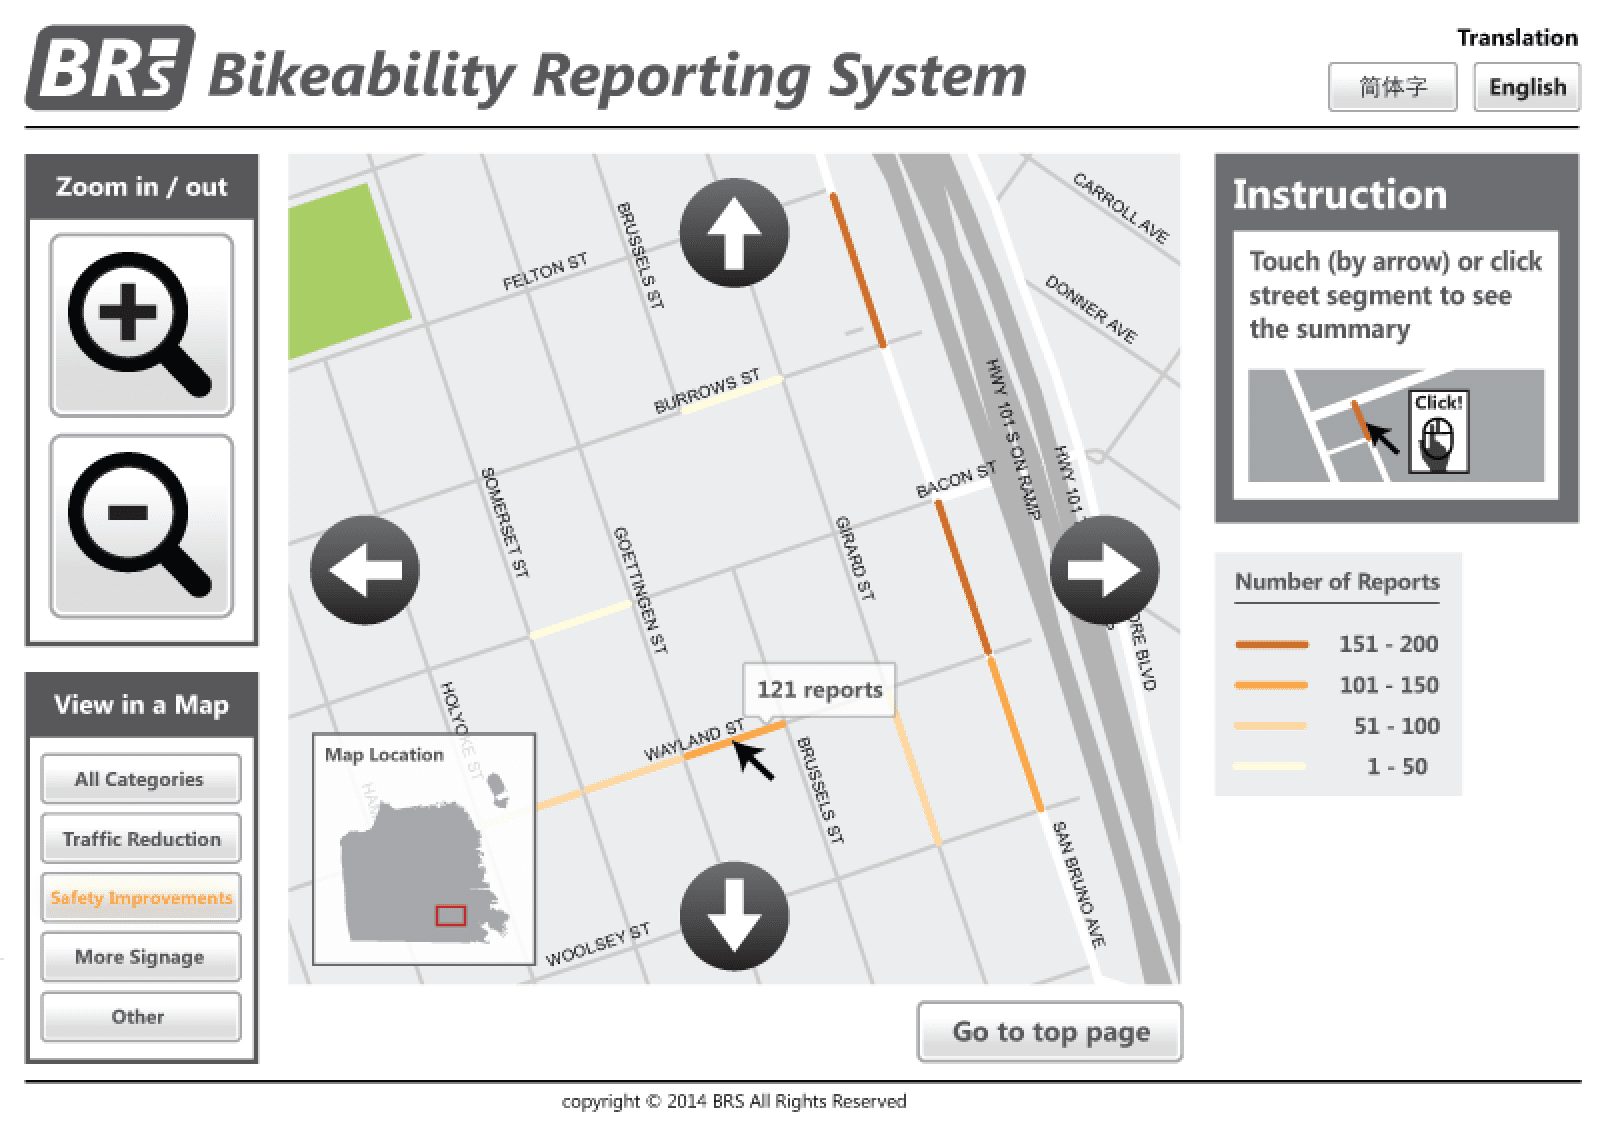
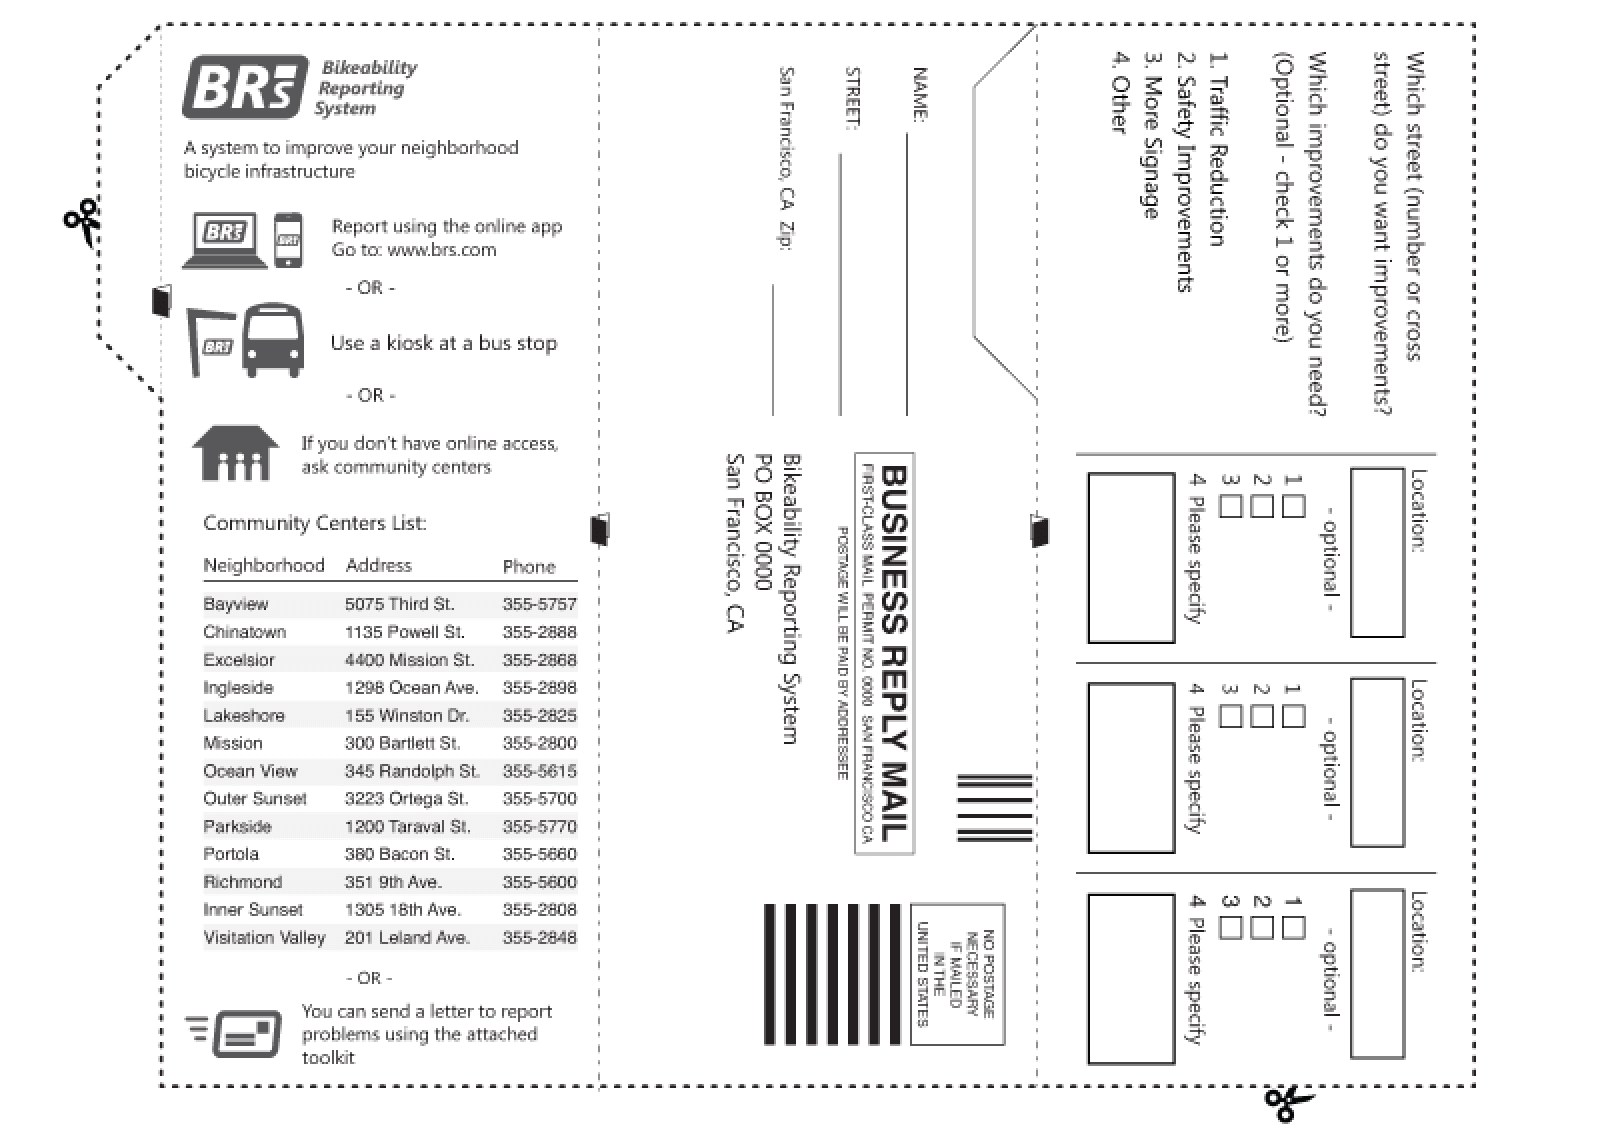
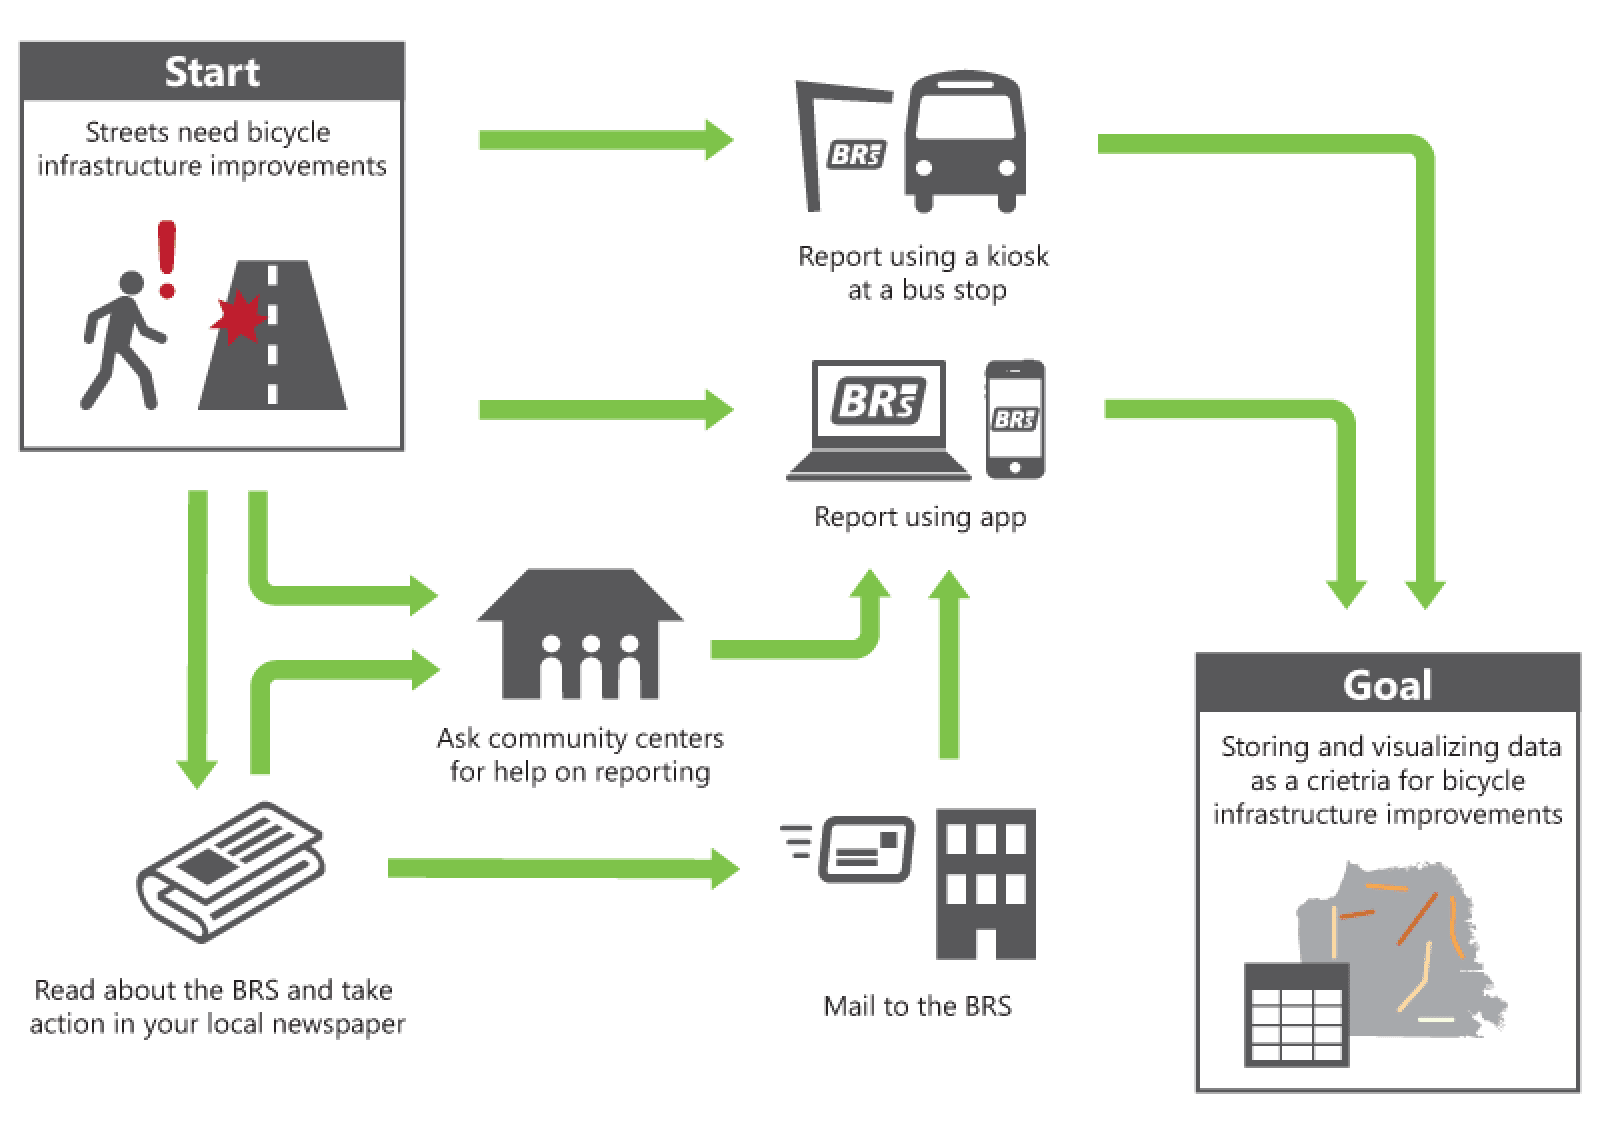
New Wave of Bikeways
This web map application shows survey results from citizens in San Francisco to ask where they need new bike paths as well as which bike paths have to be improved.
HTML · CSS · JavaScript · D3 · Leaflet · ArcGIS · R
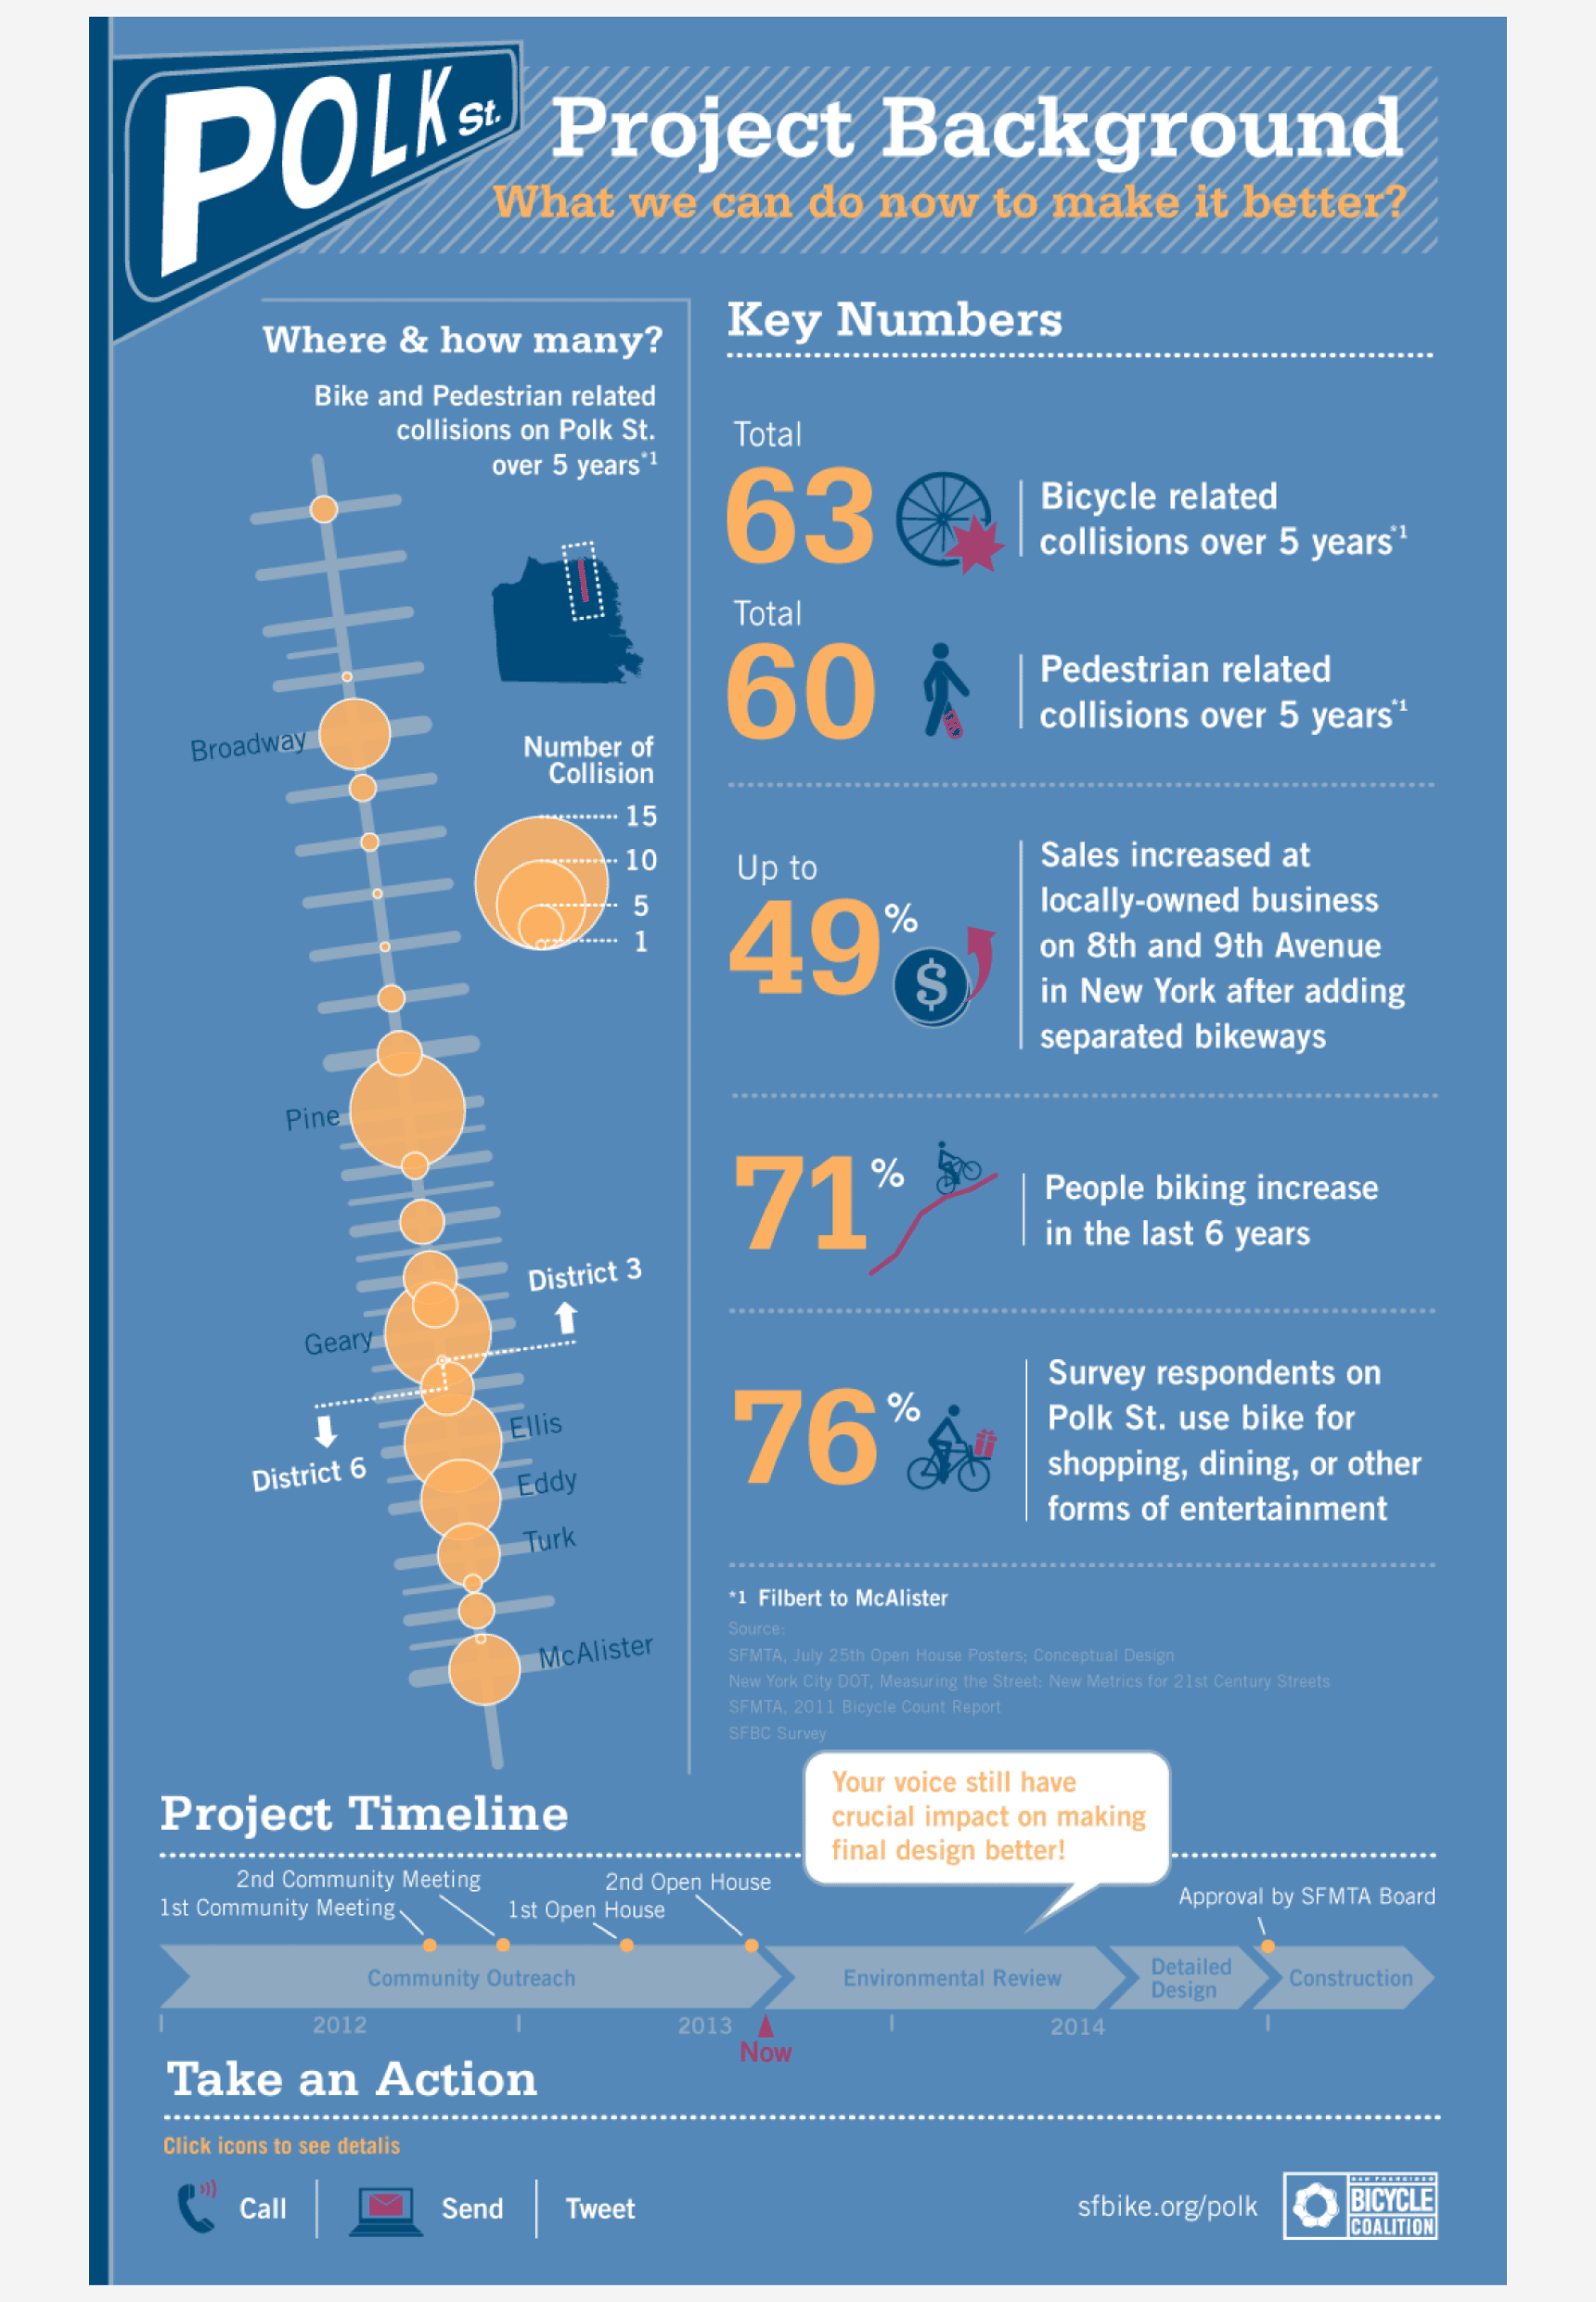
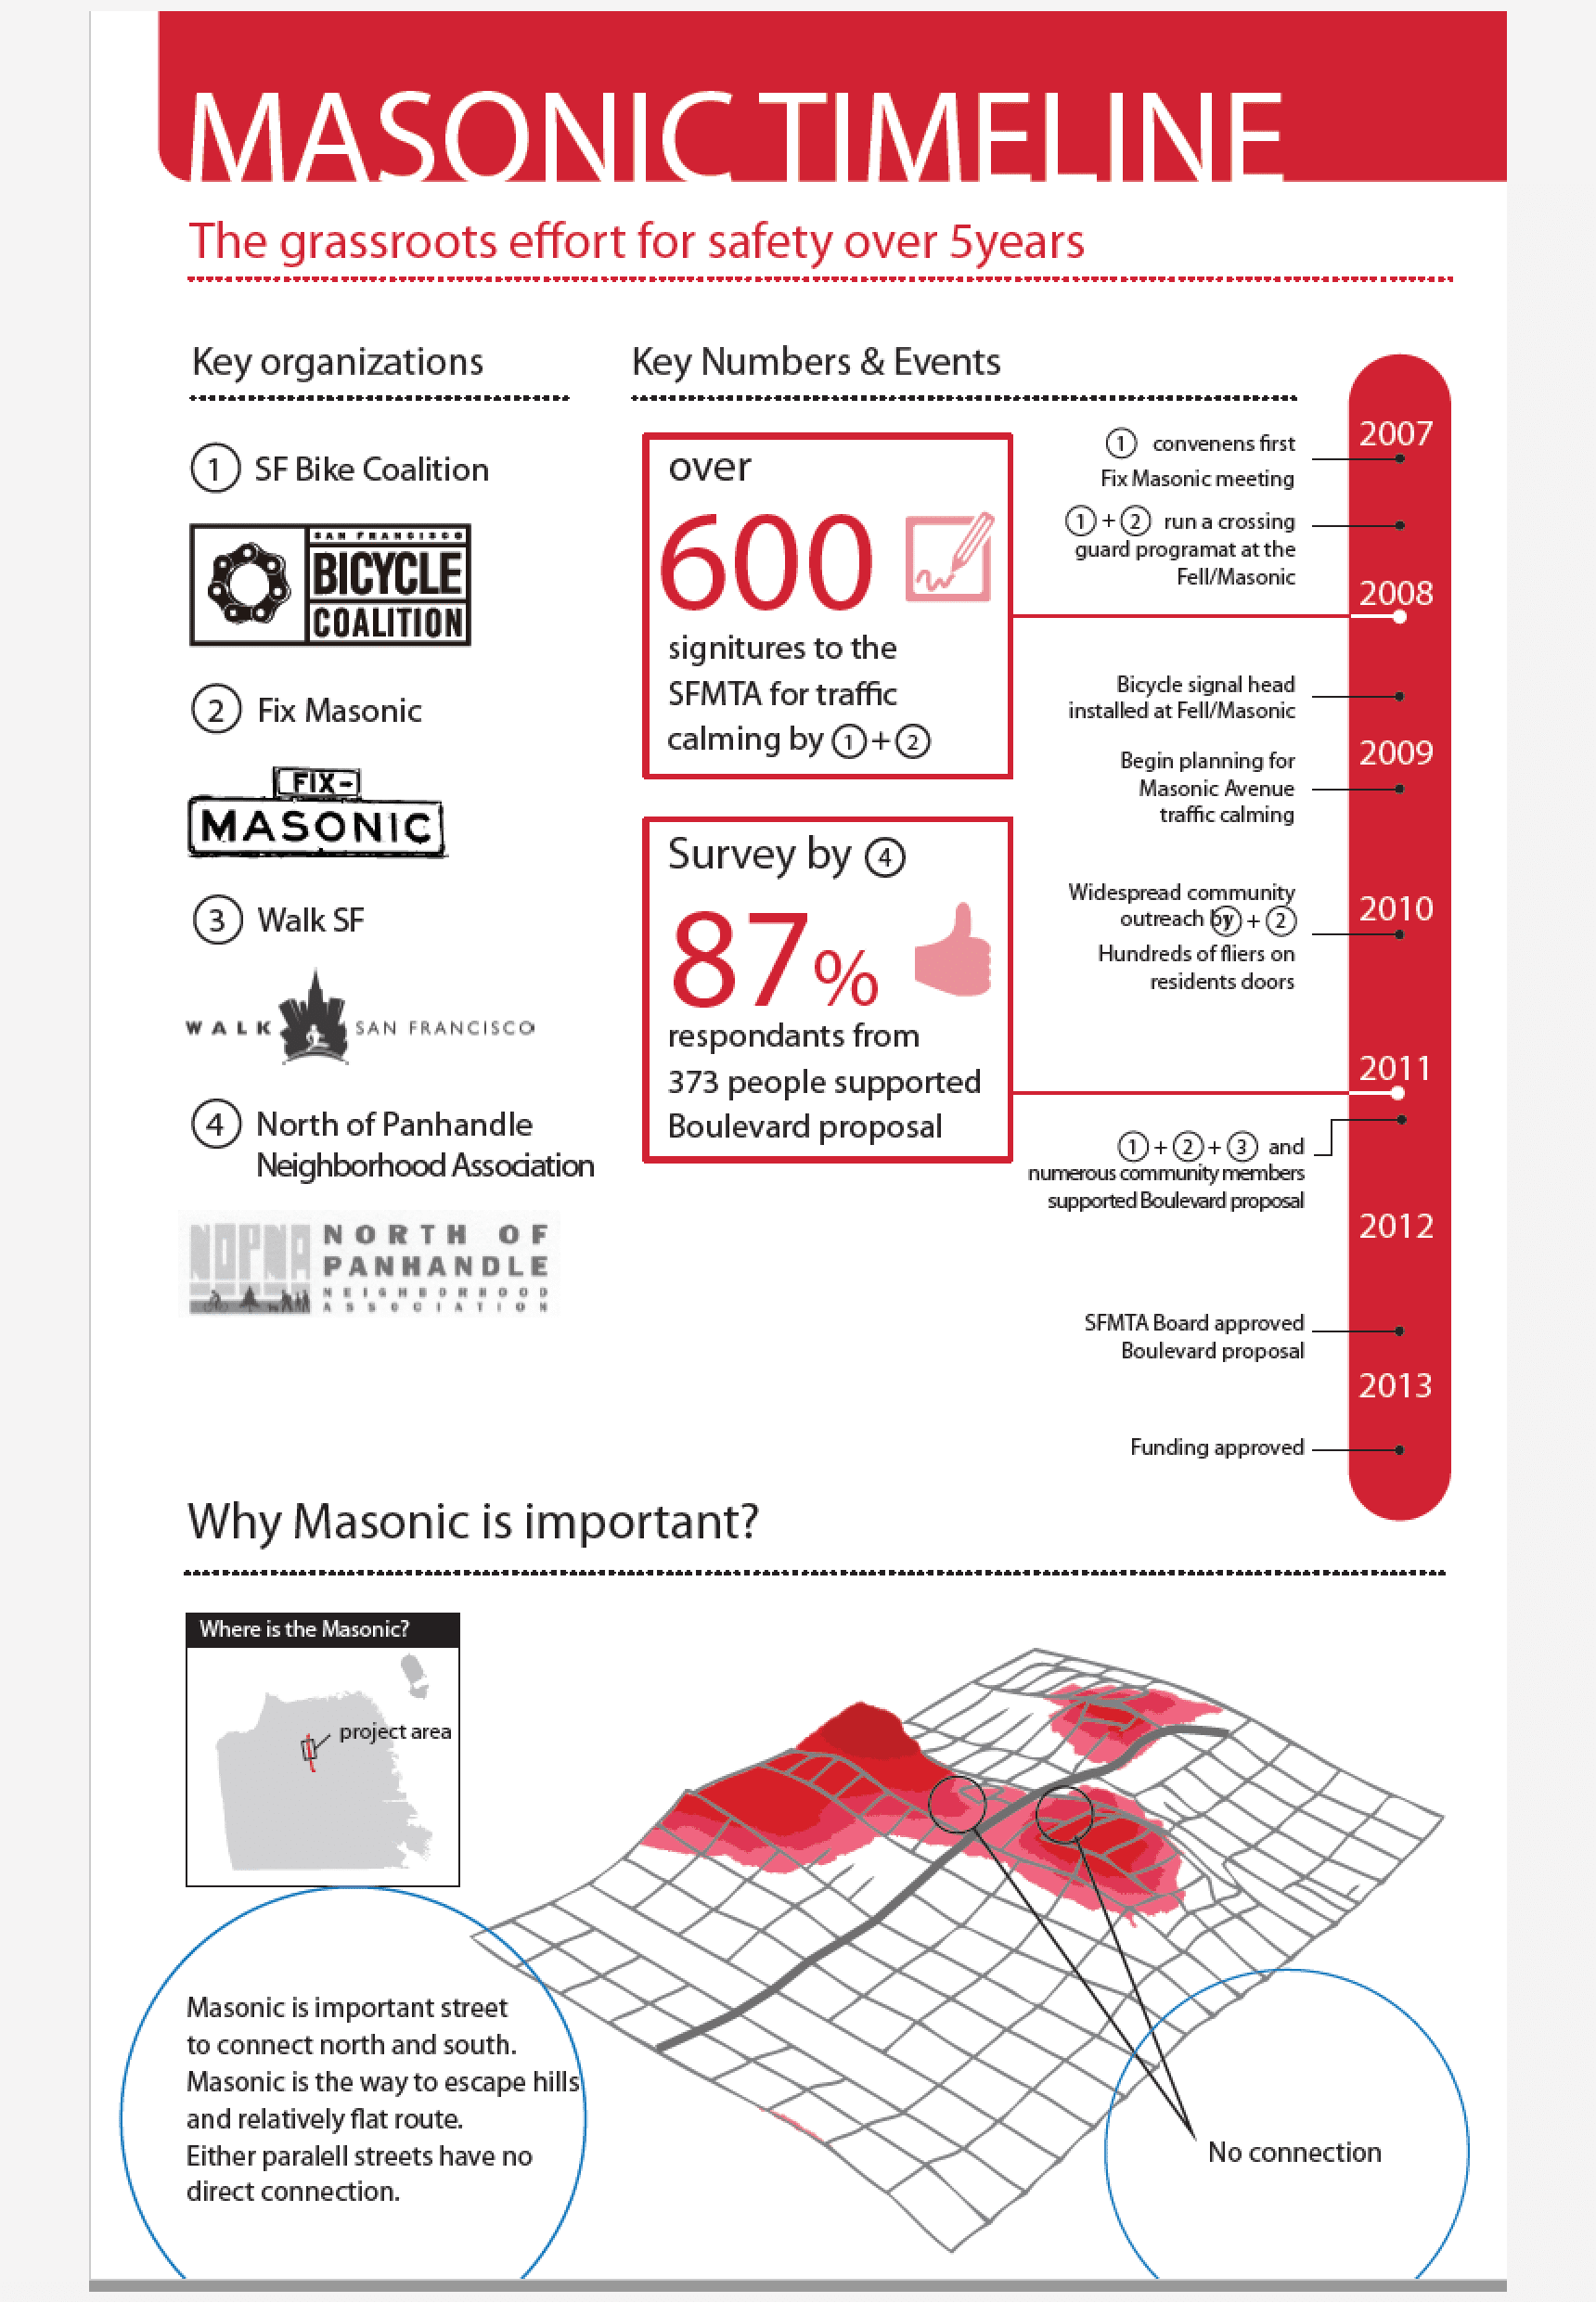
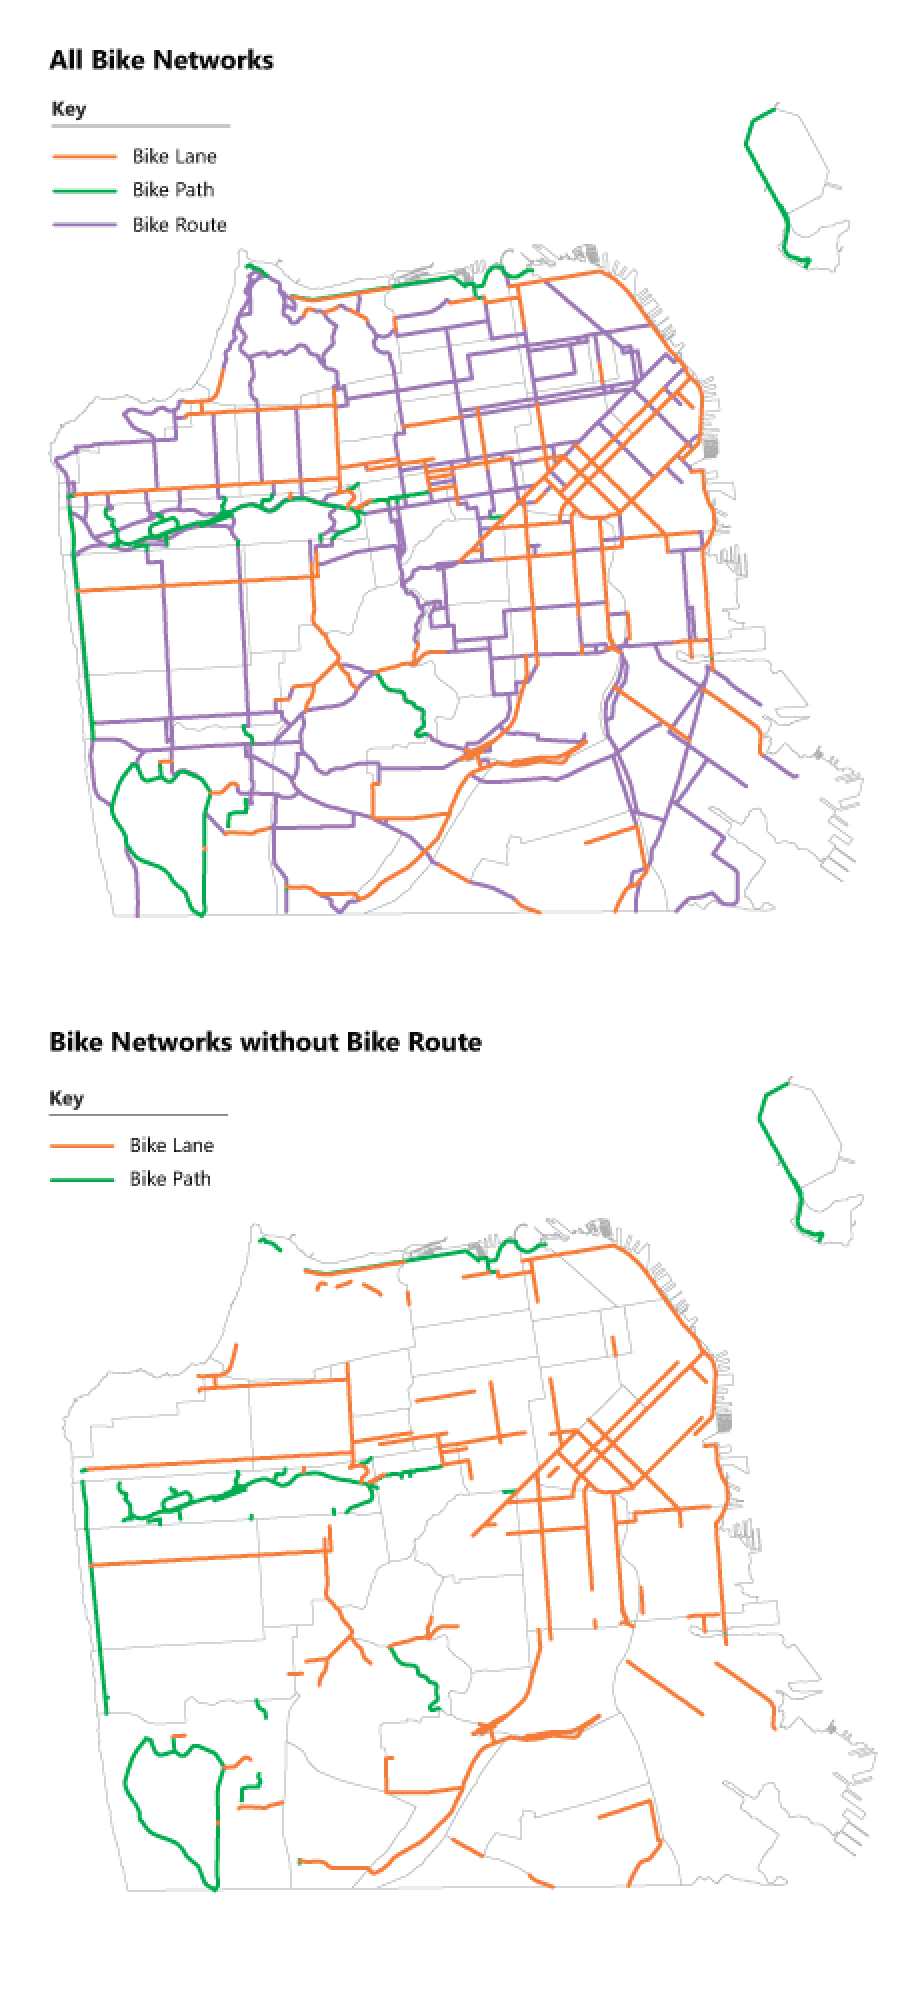
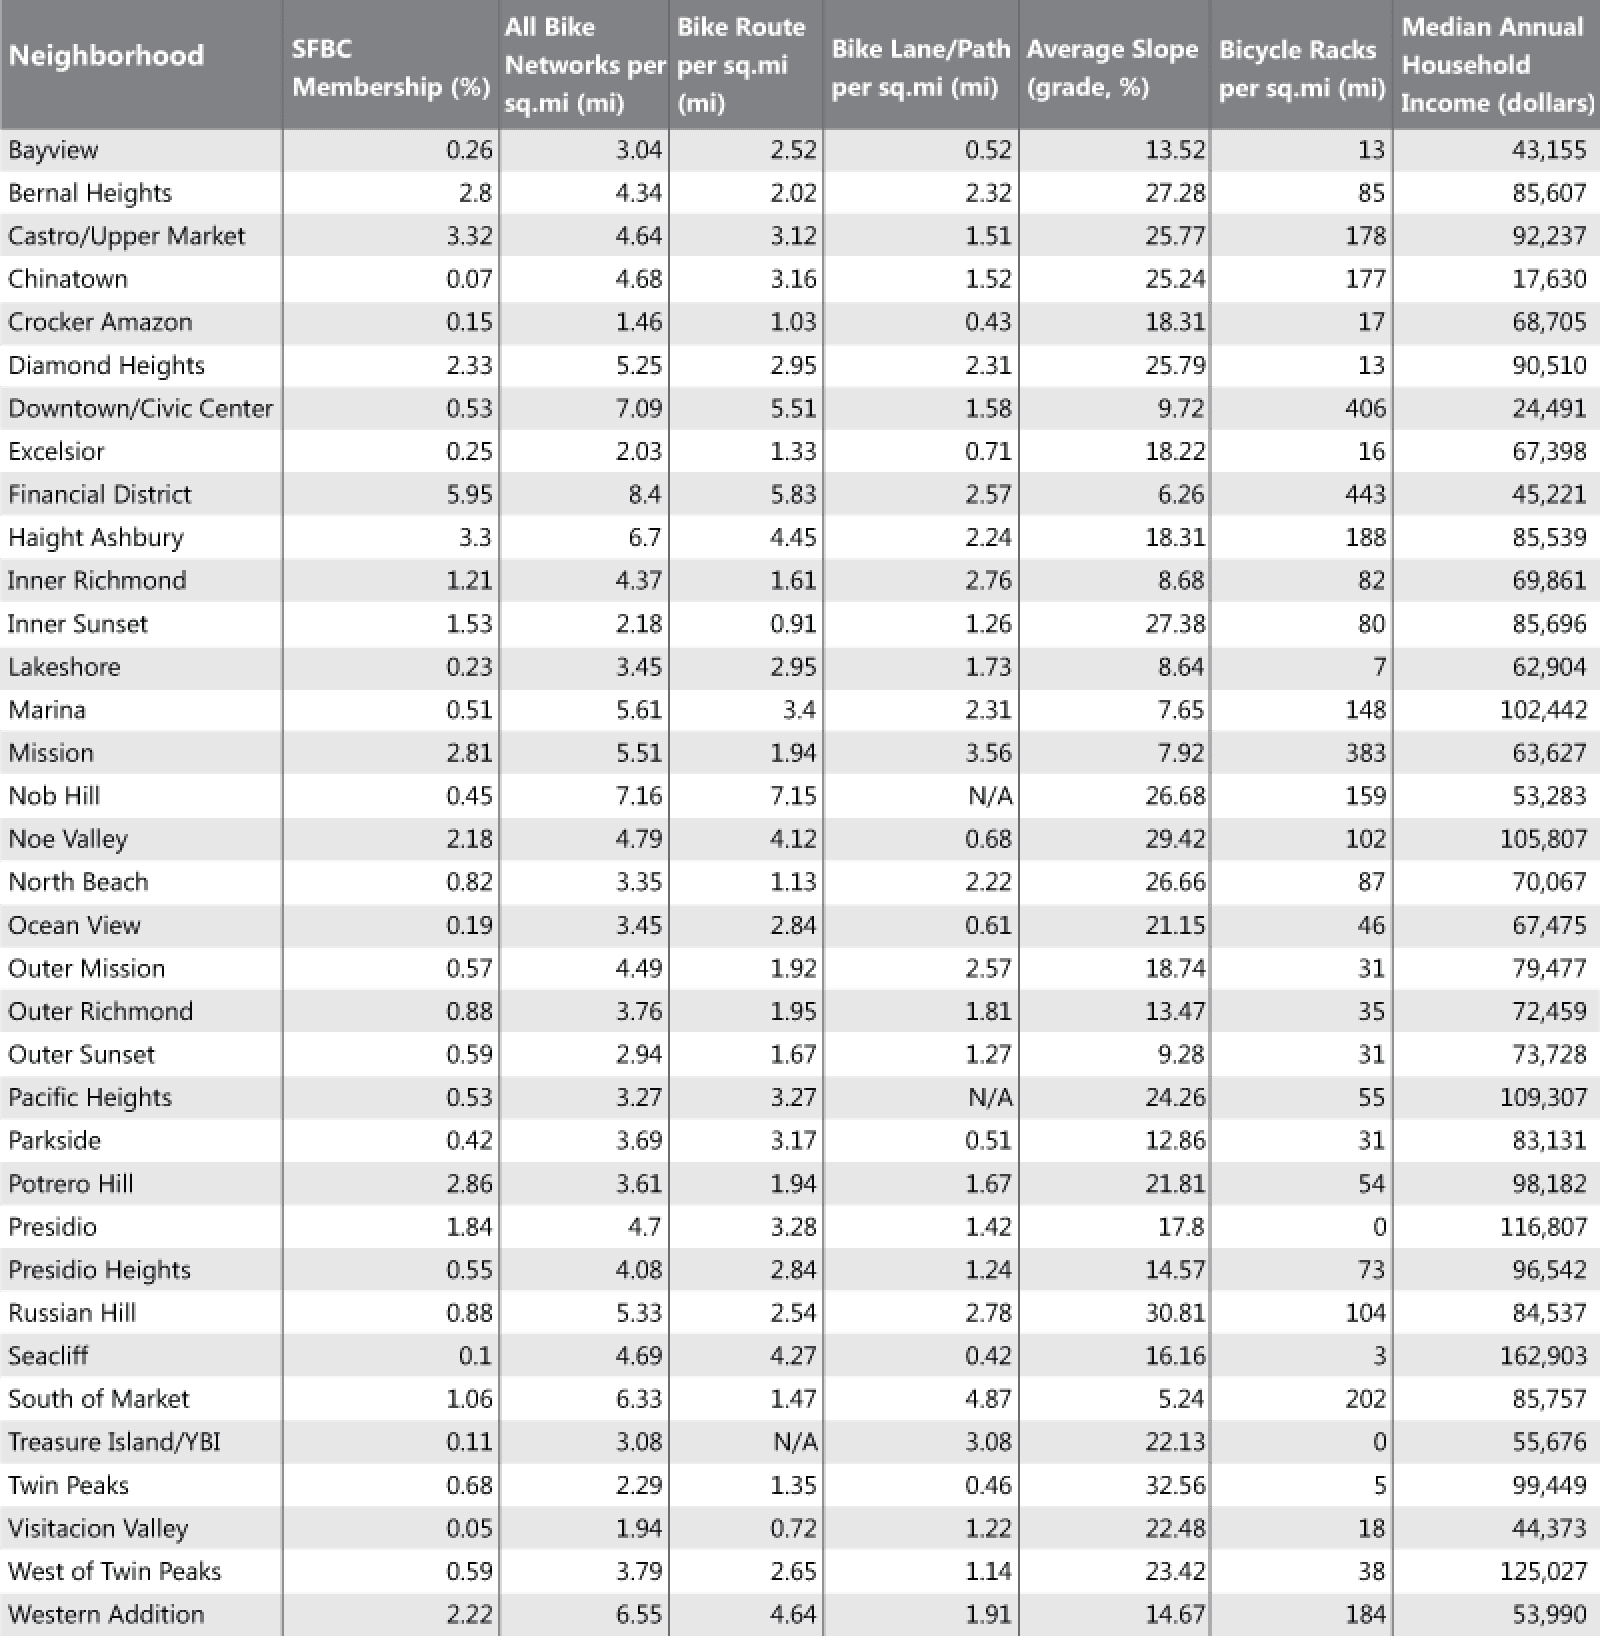
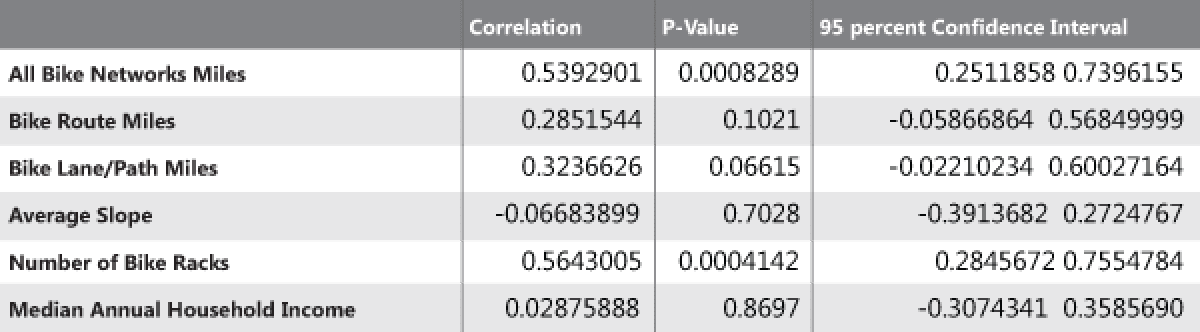
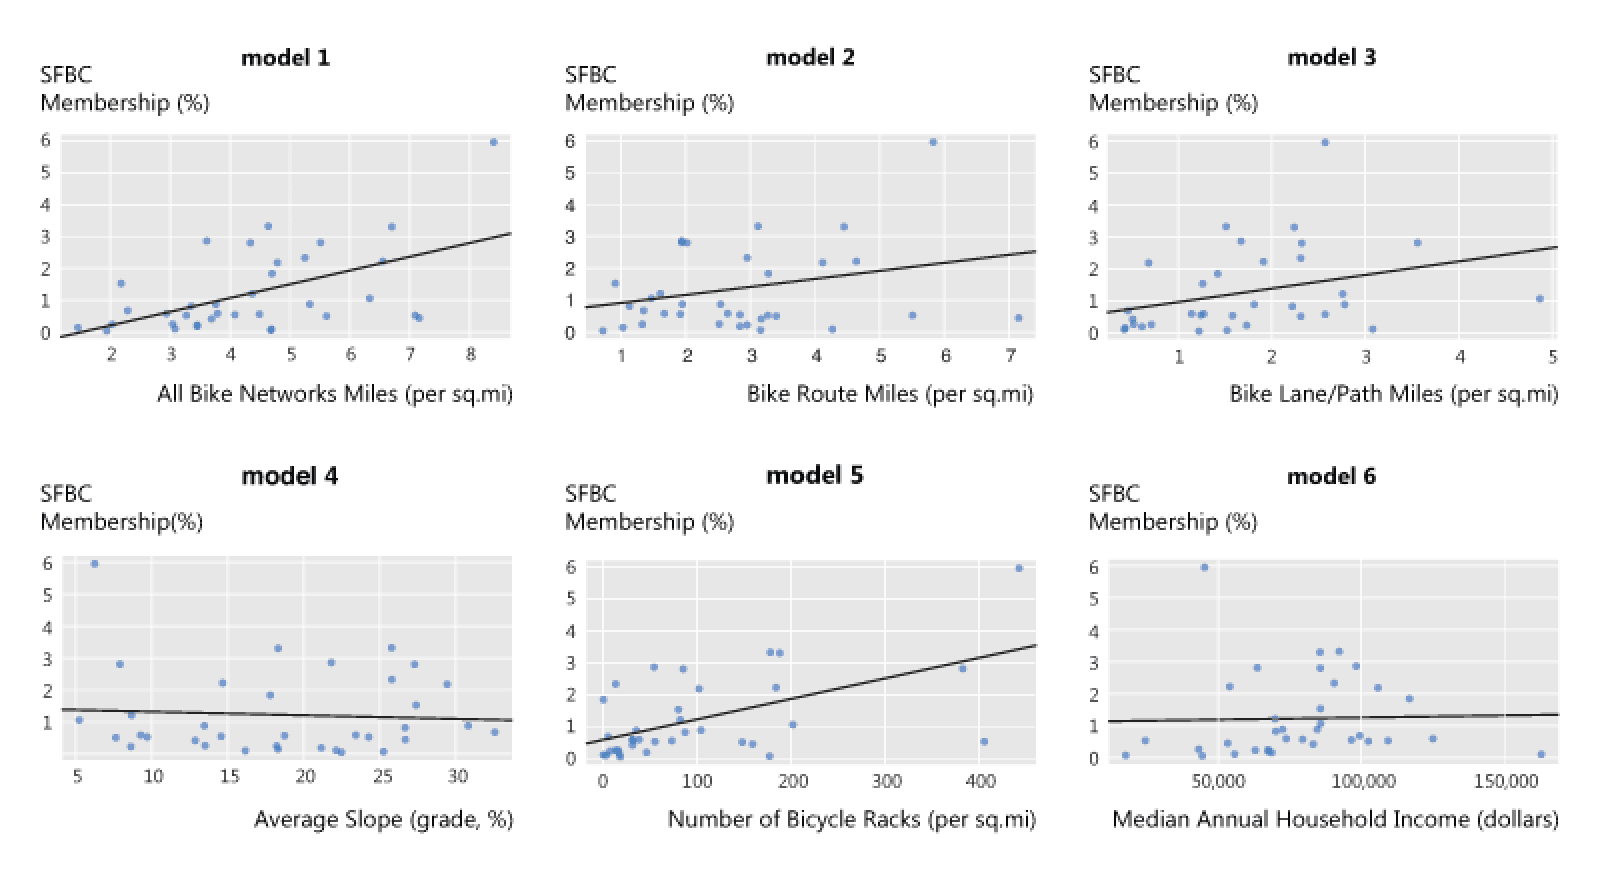
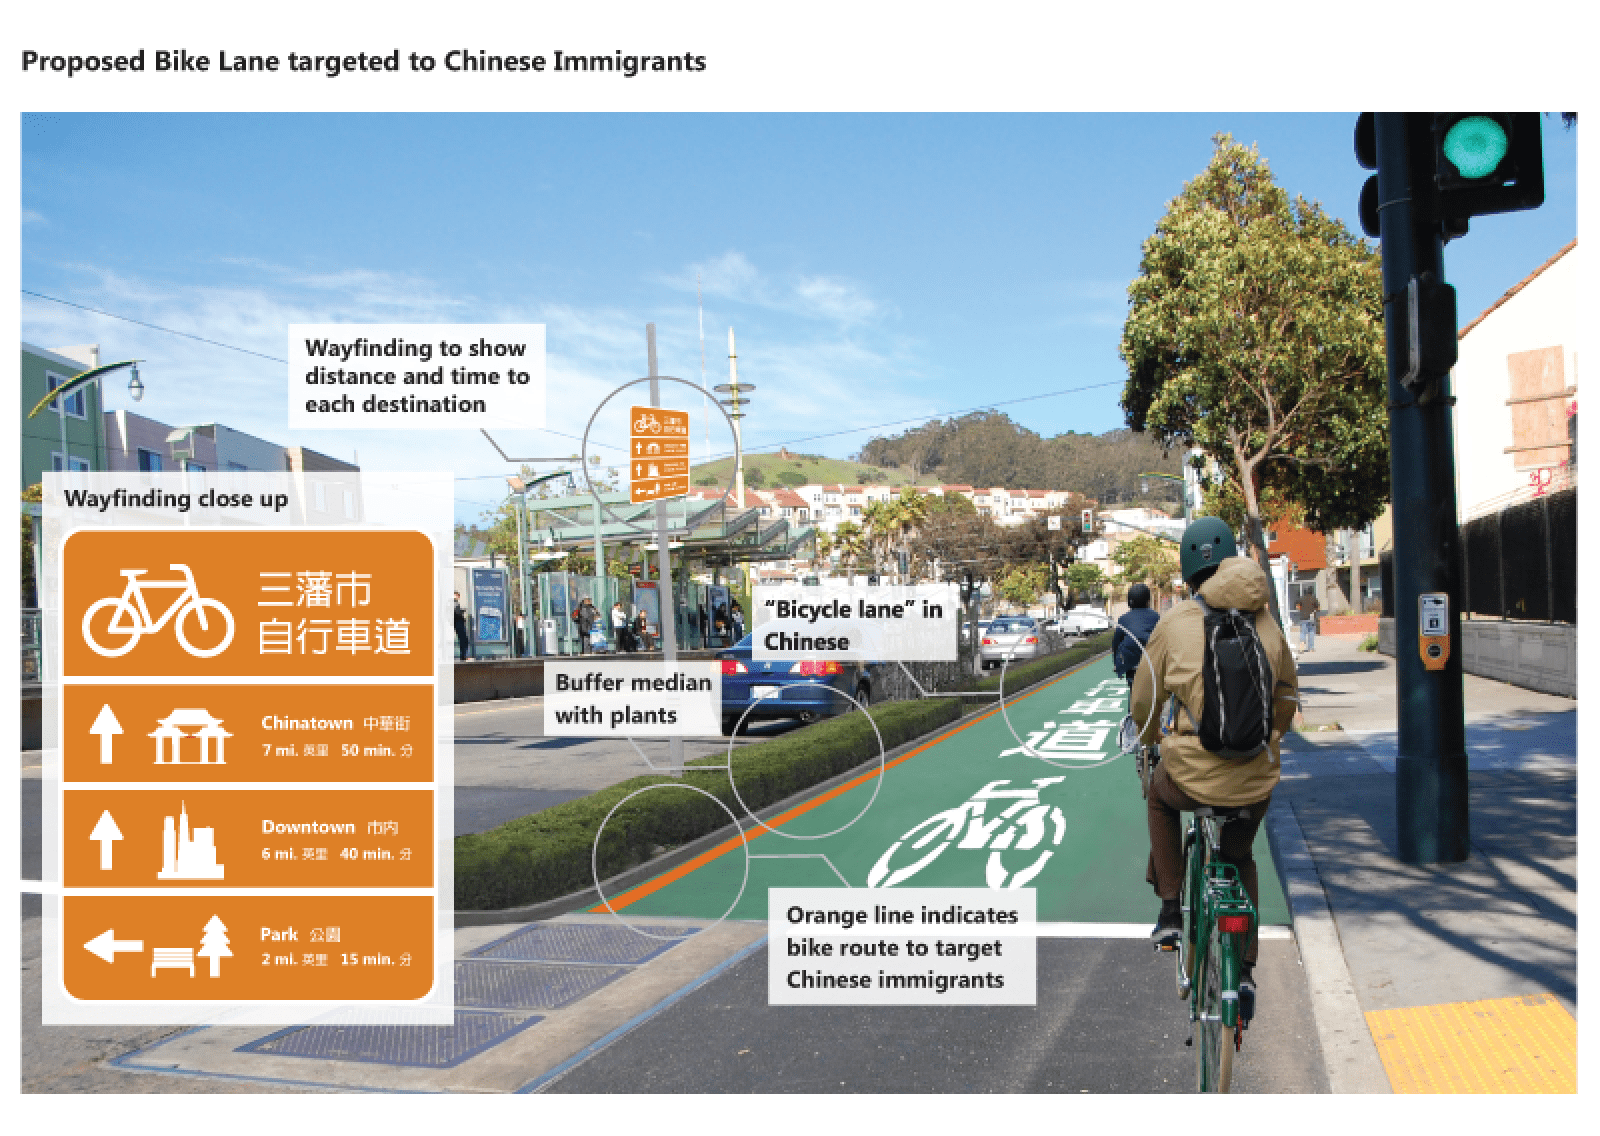
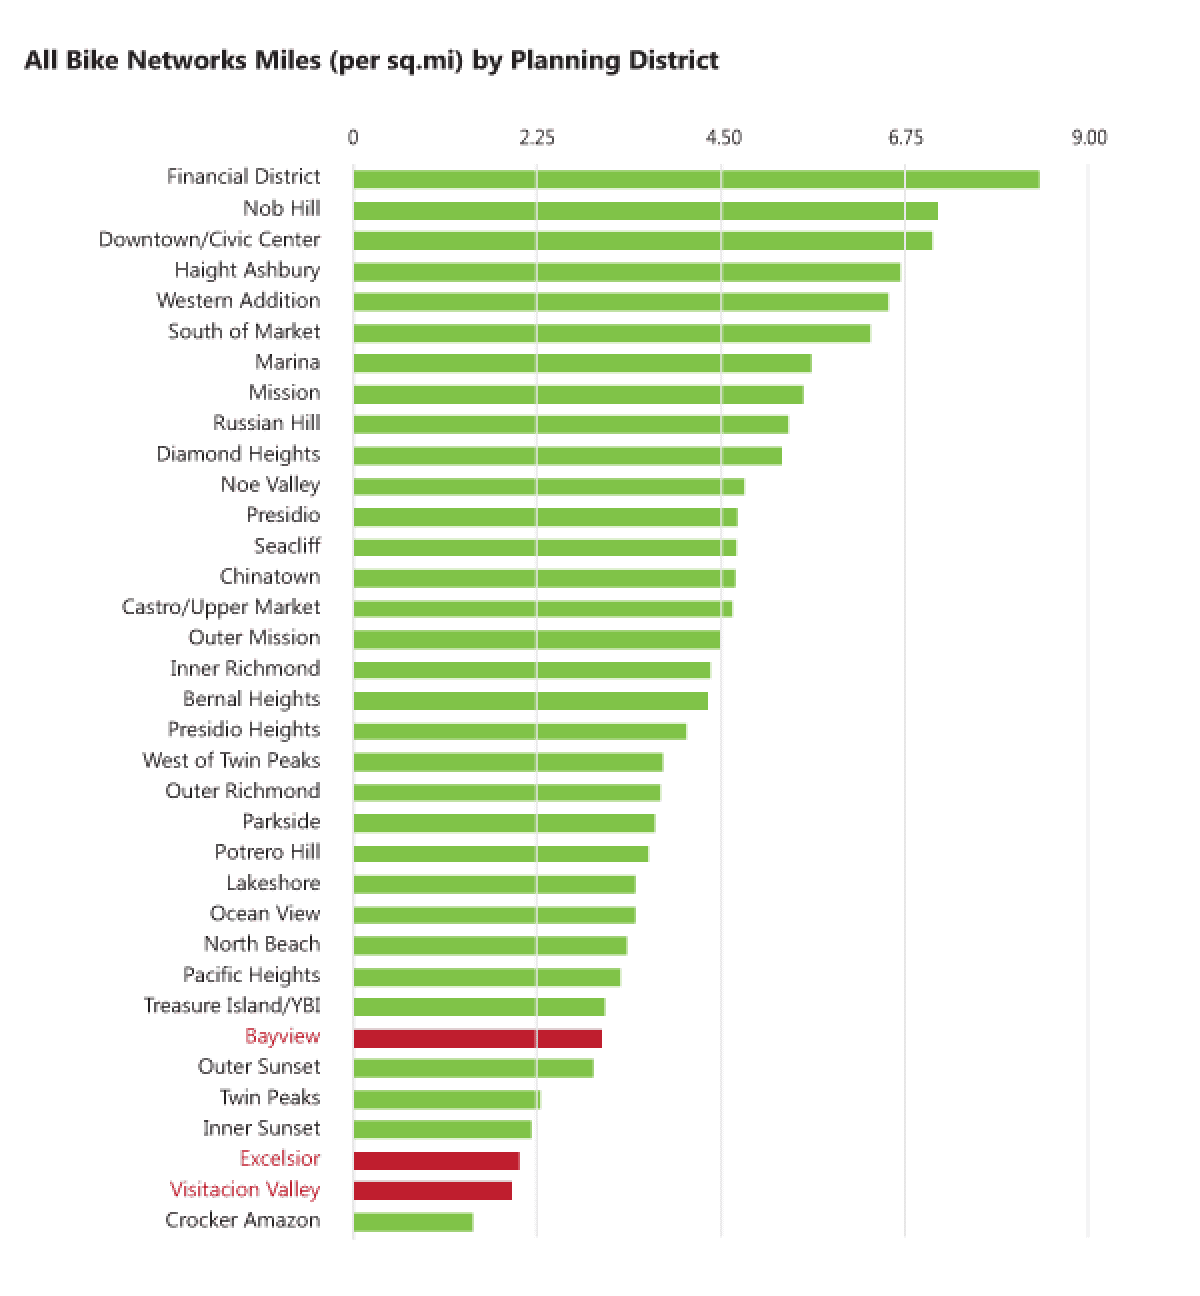
Info Graphics
for Outreach
These infographics were created to advocate the improvement of streets for safer biking by using R, ArcGIS, Illustrator, and Photoshop.
Illustrator · ArcGIS · R · Photoshop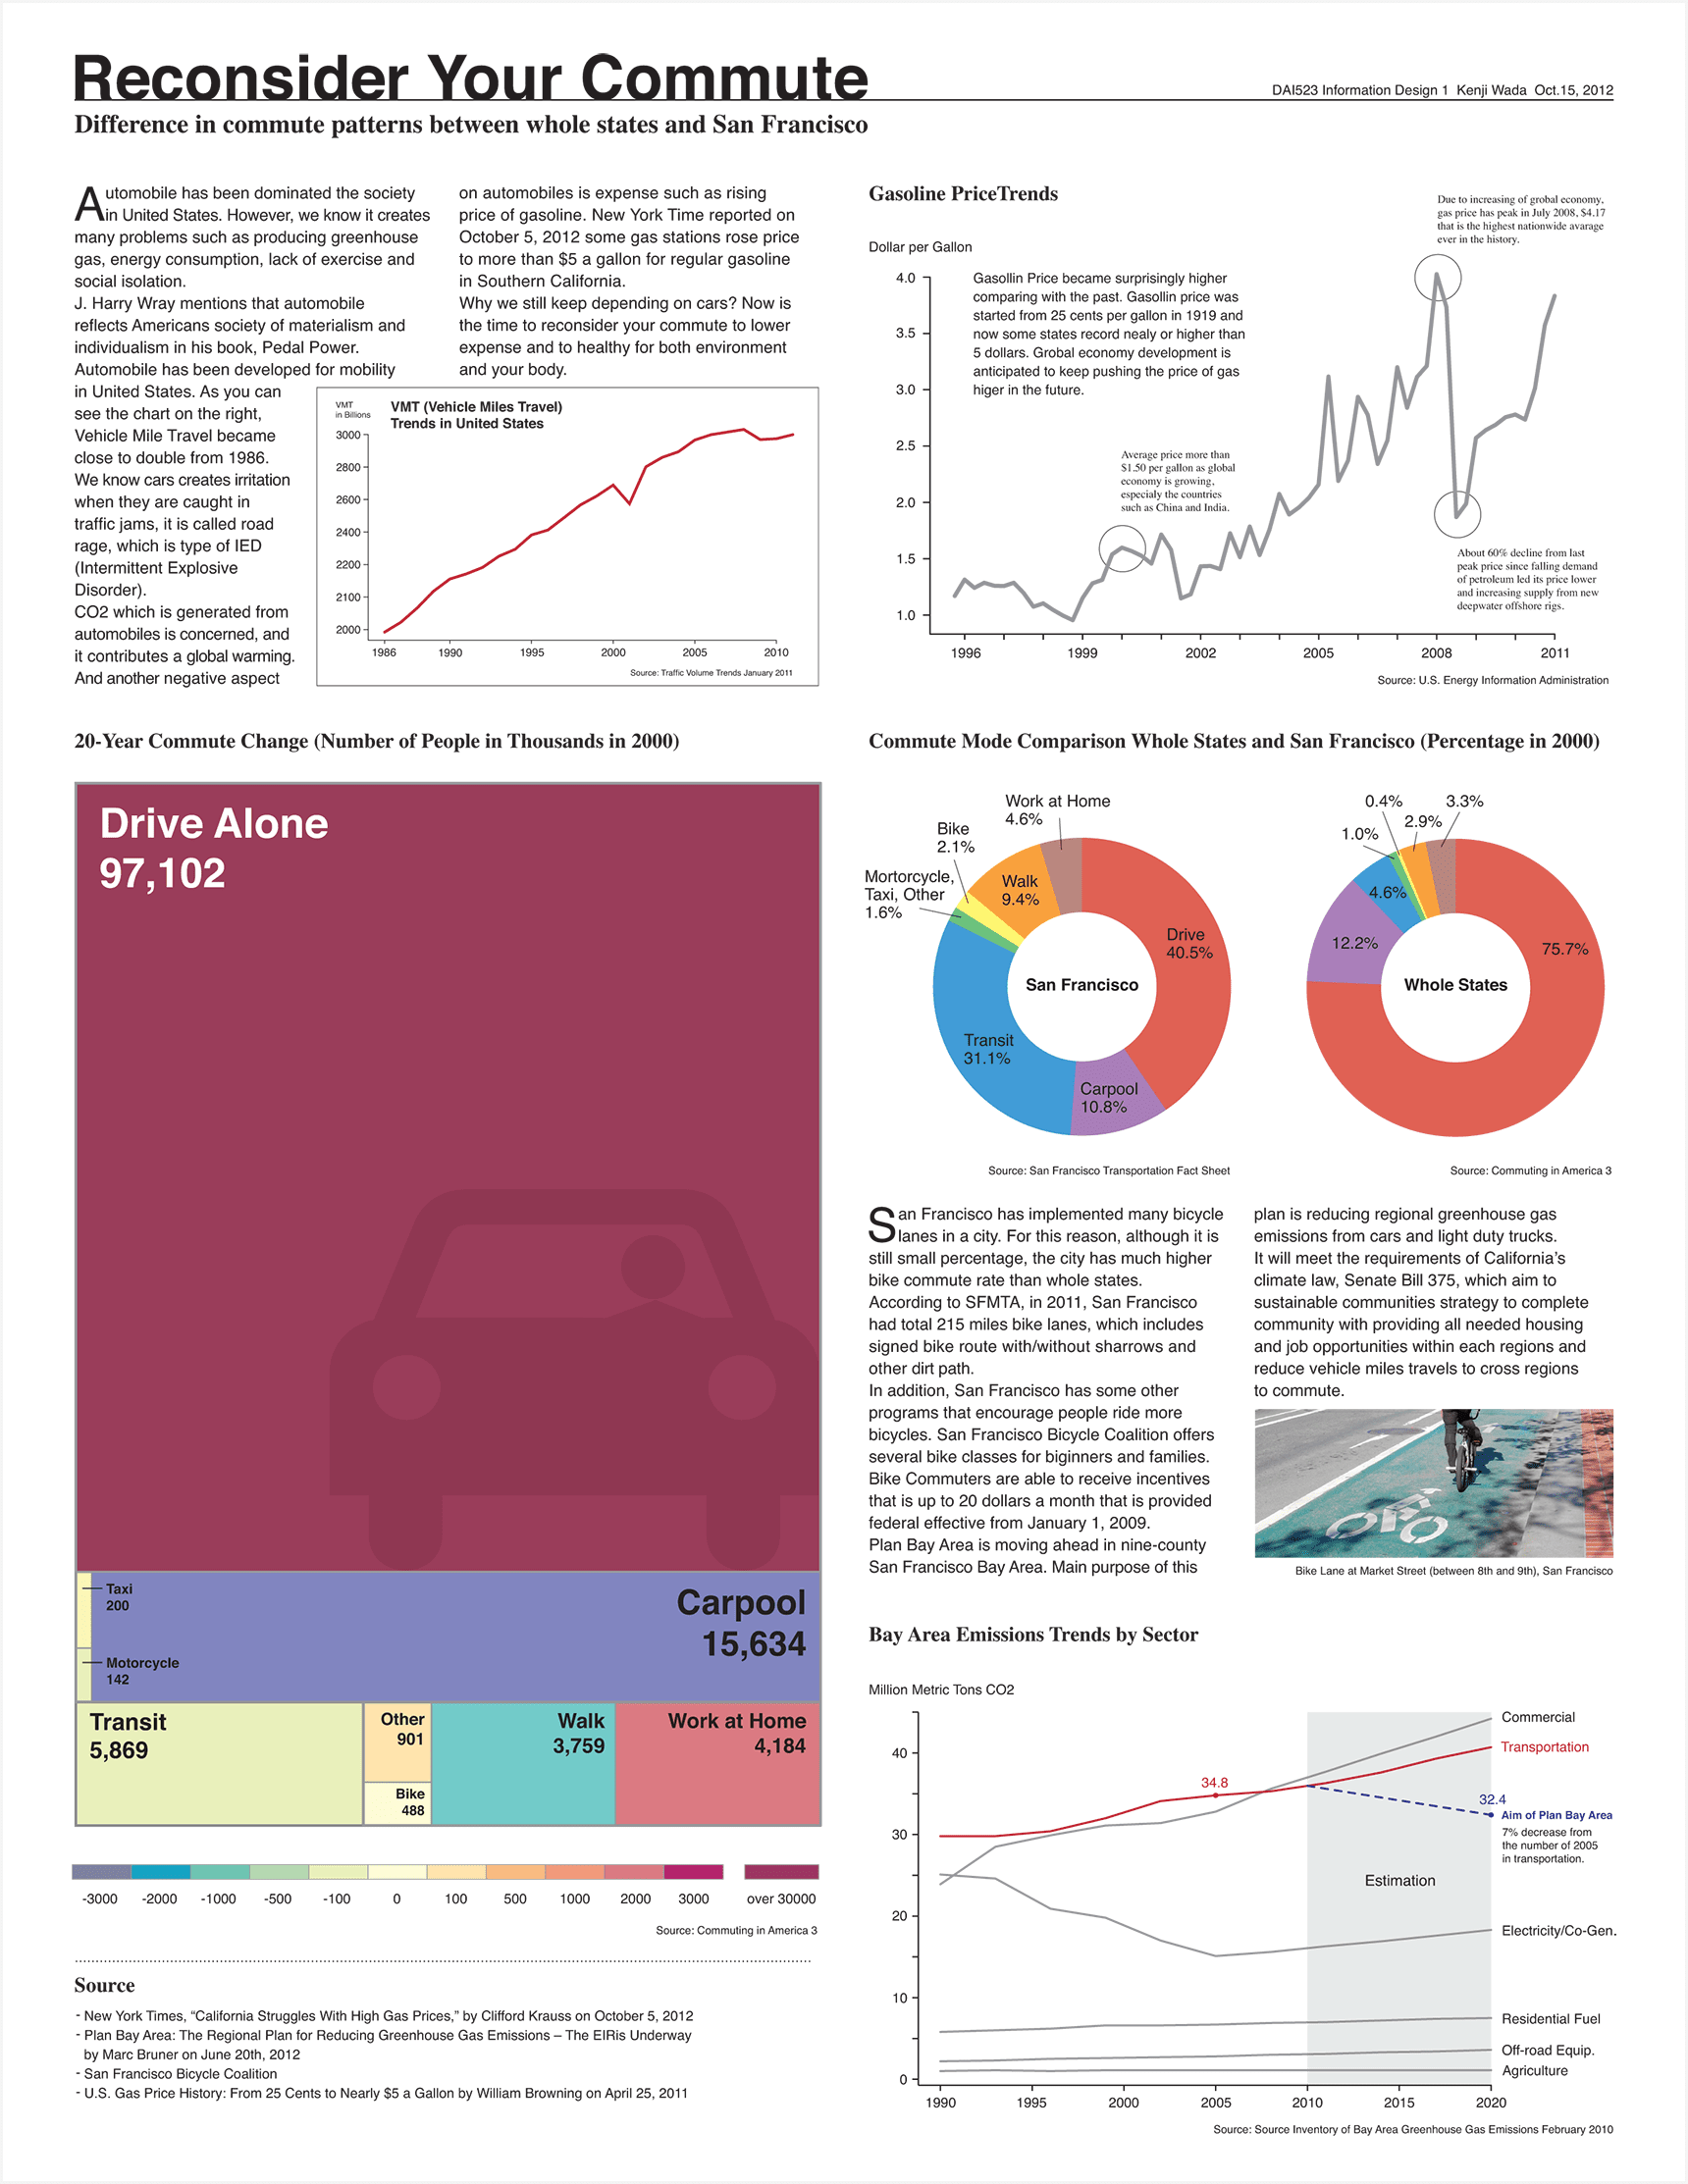
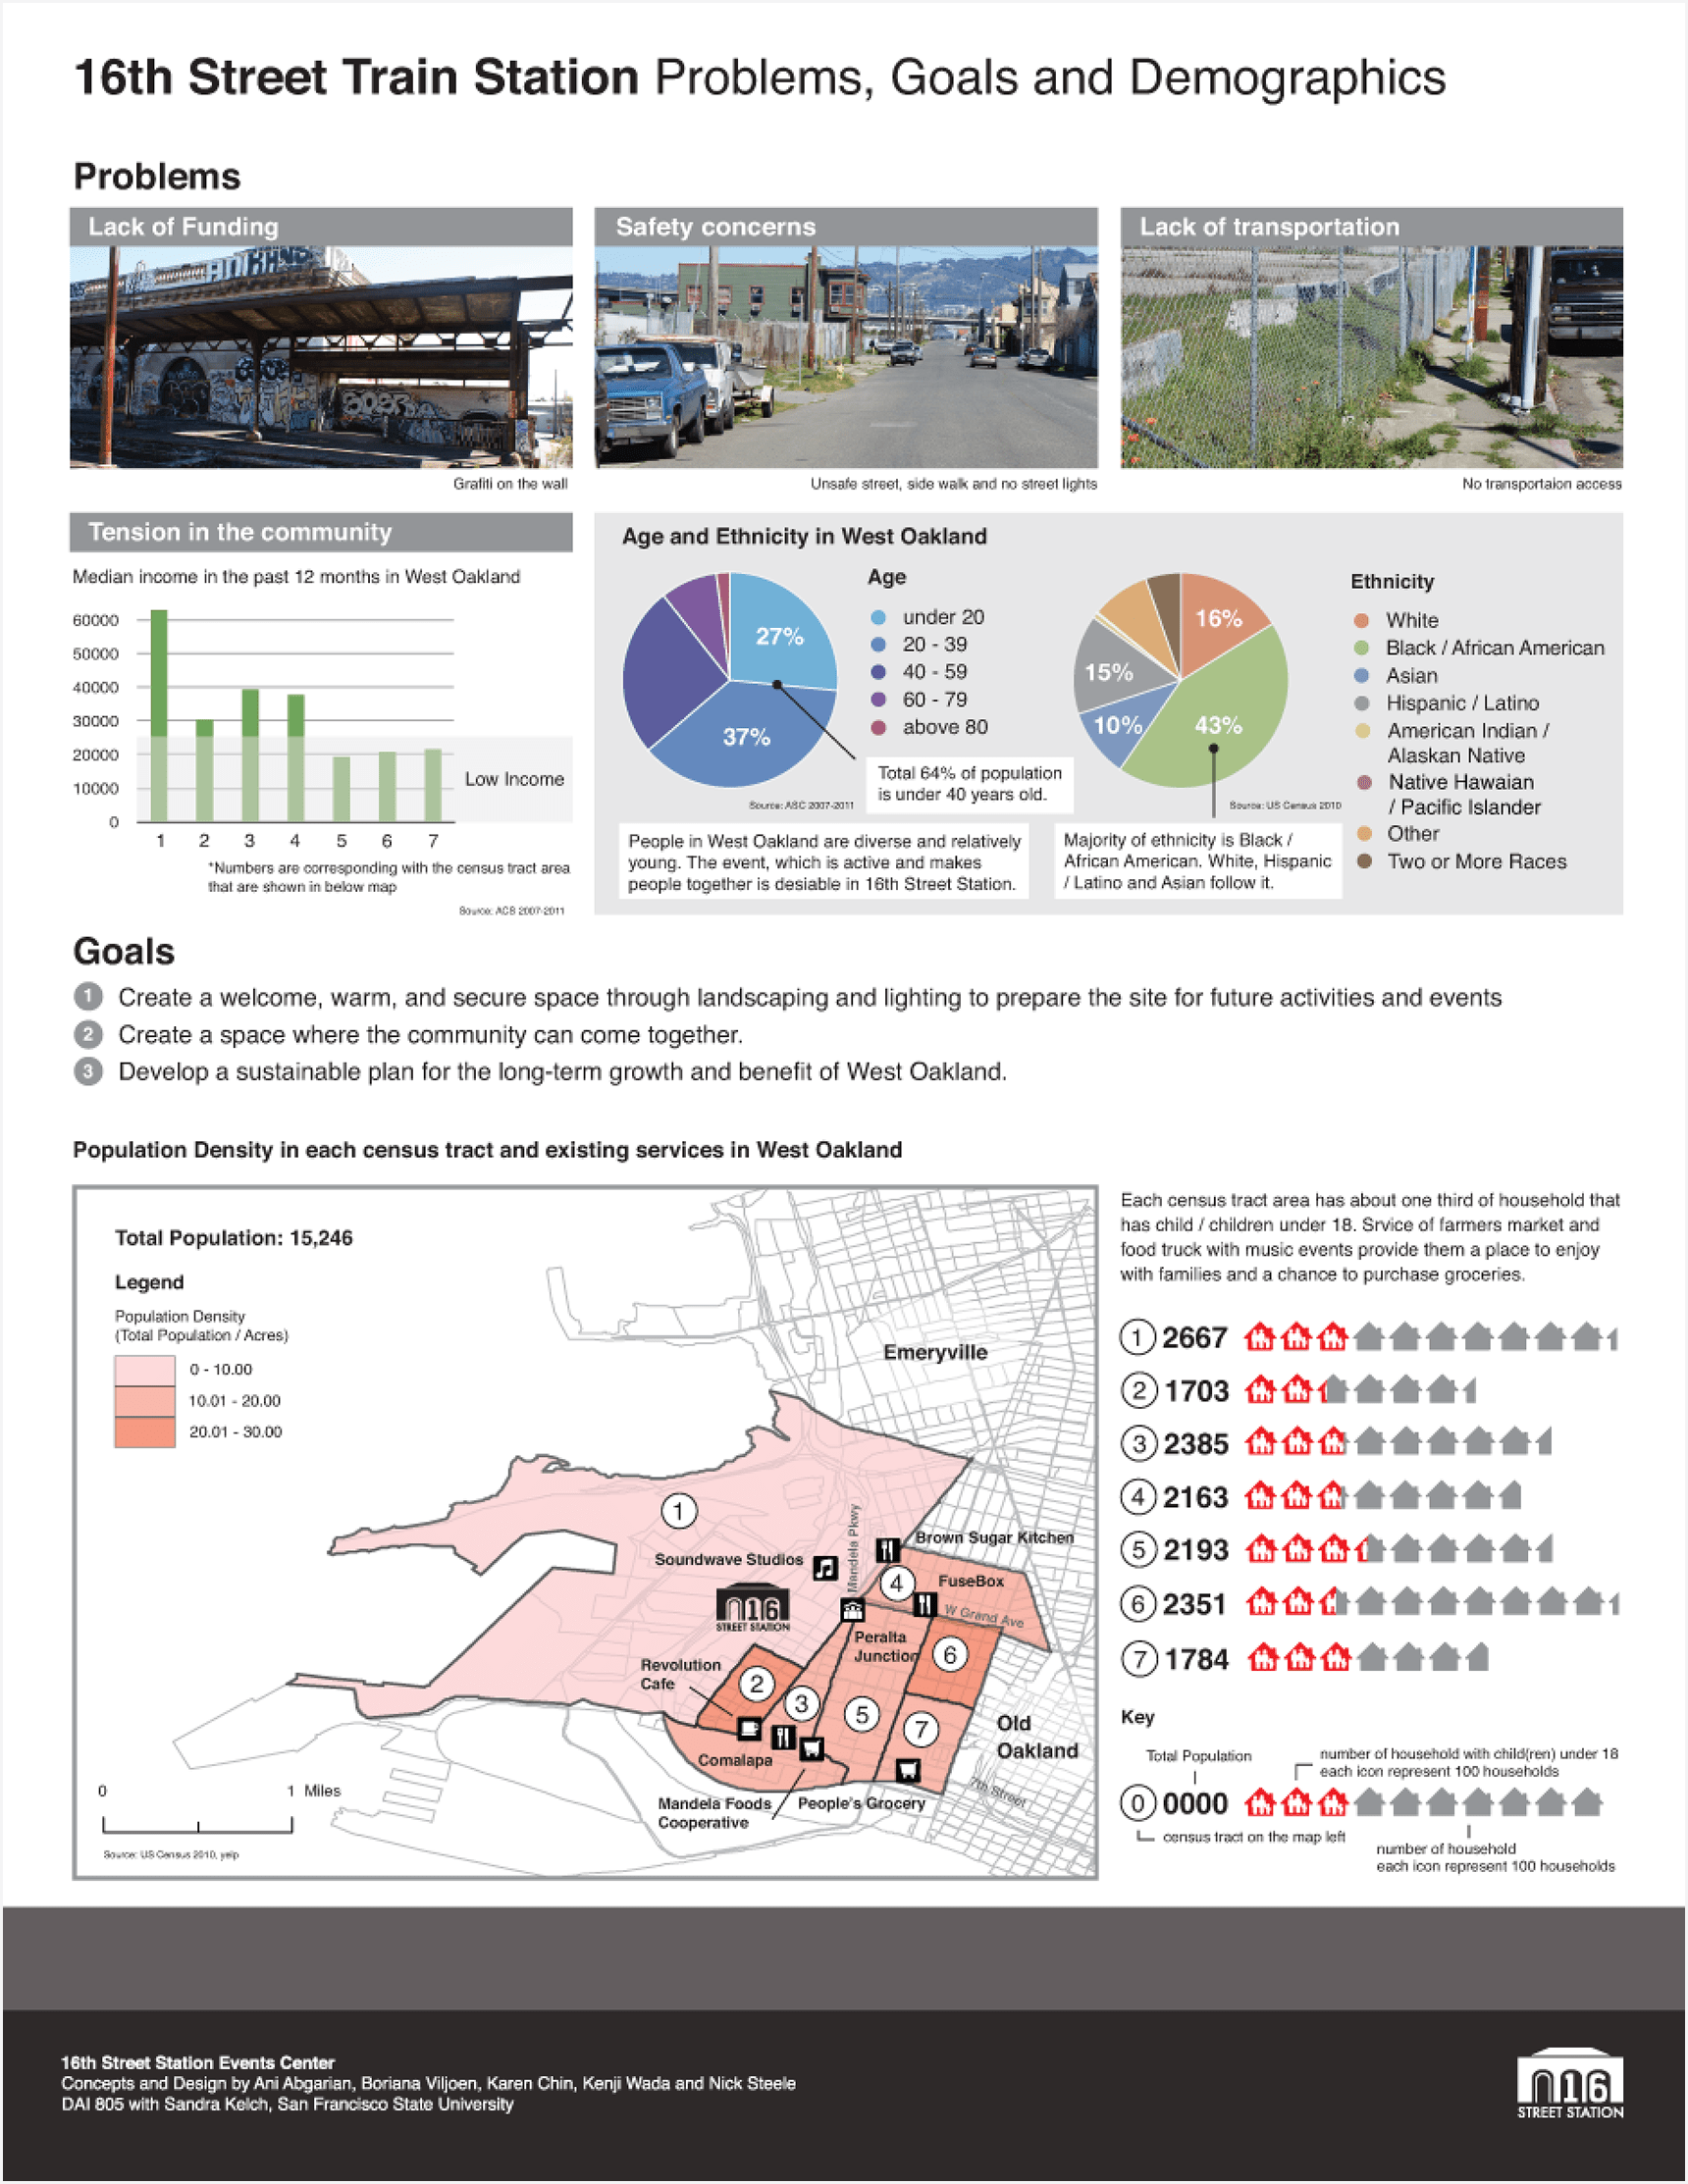
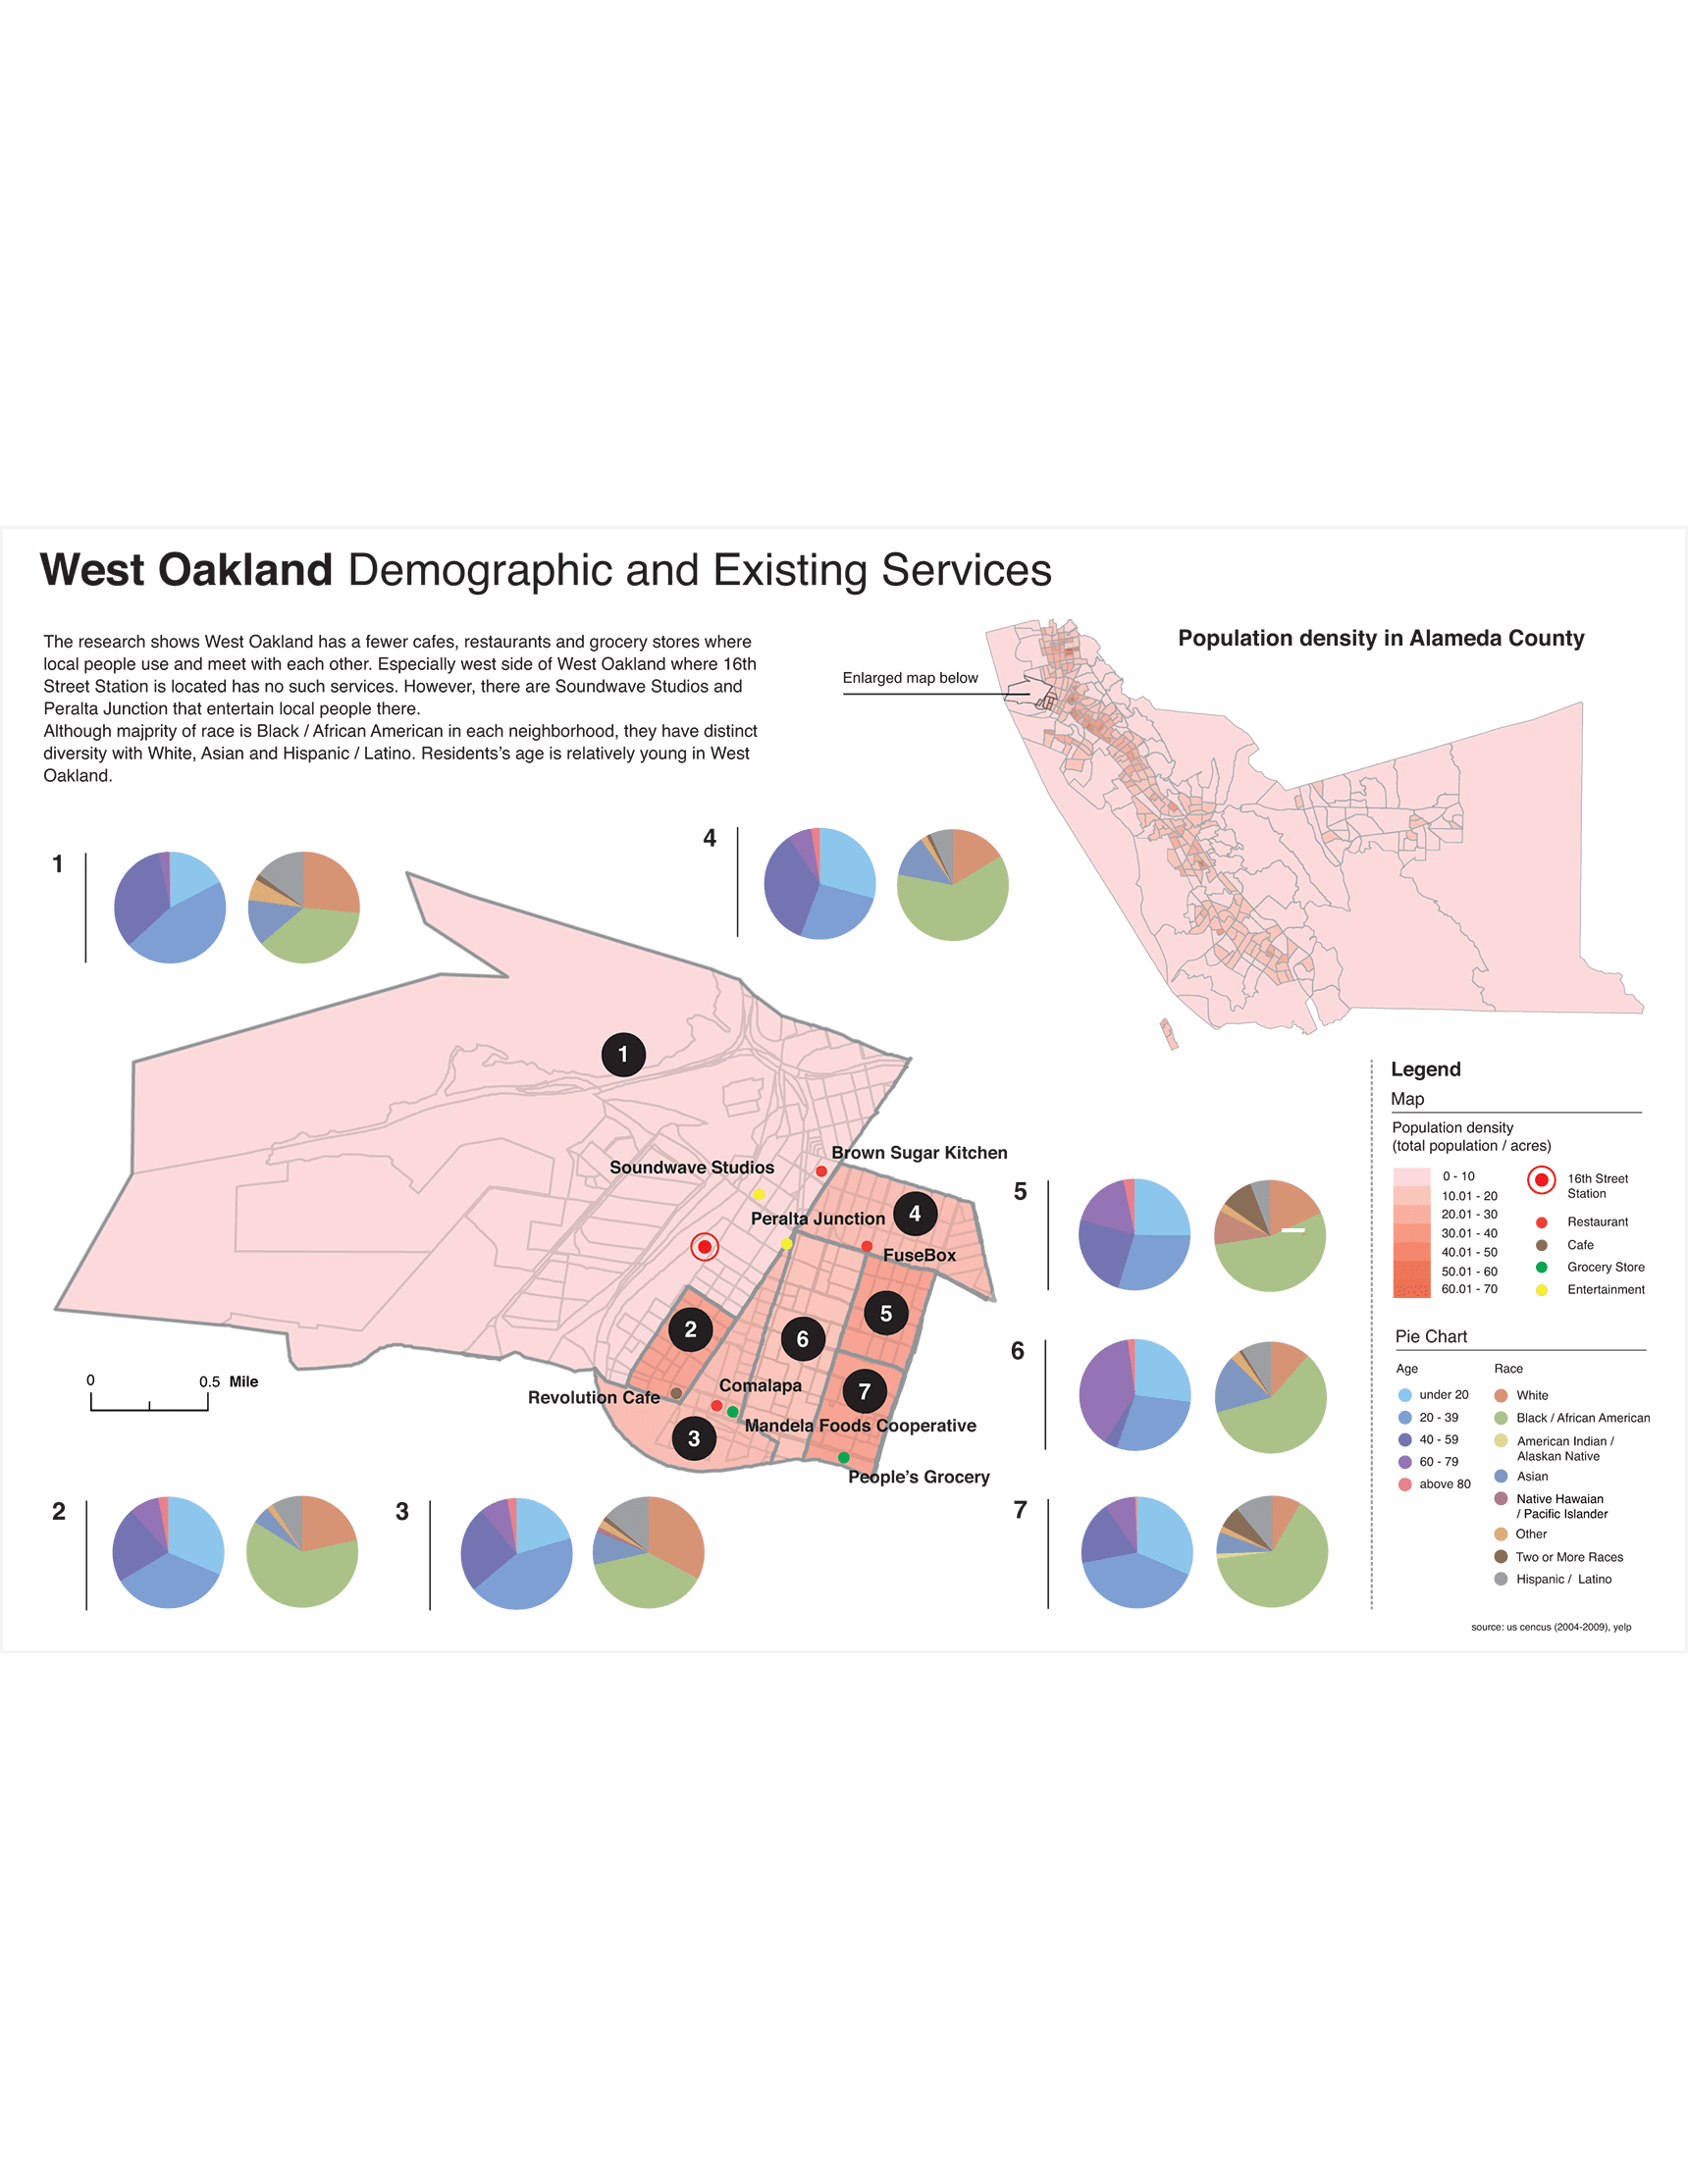
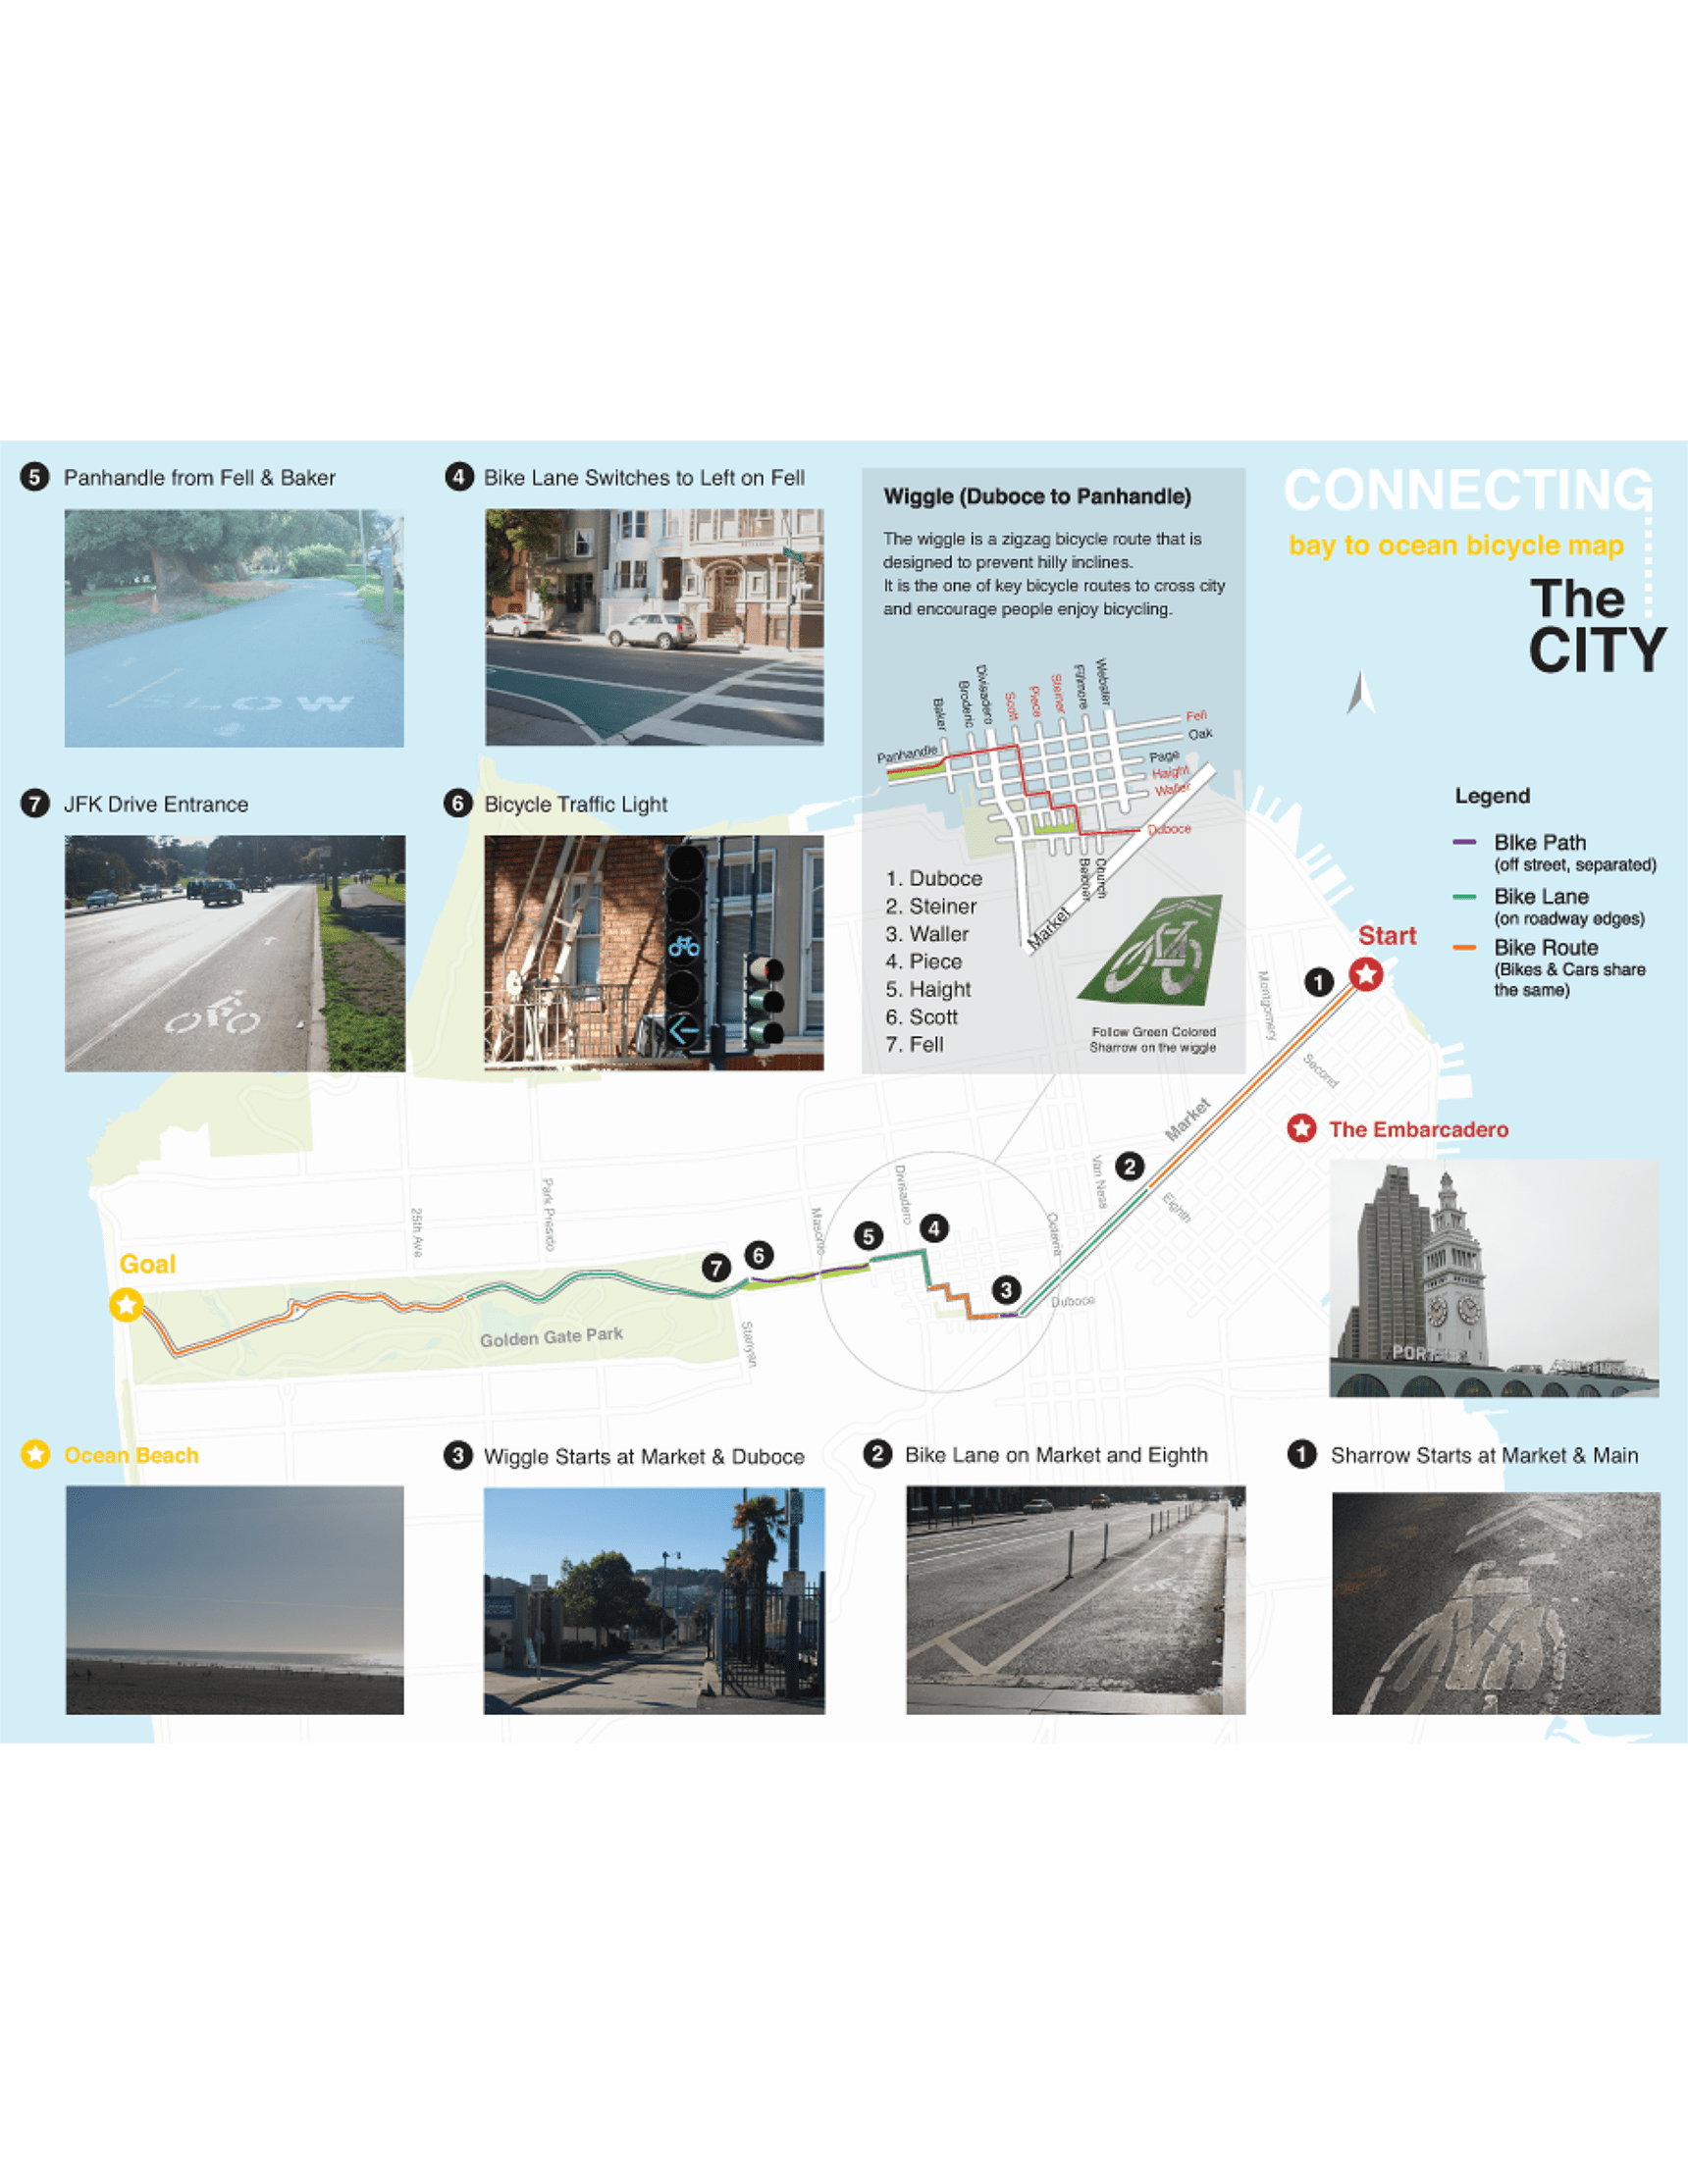
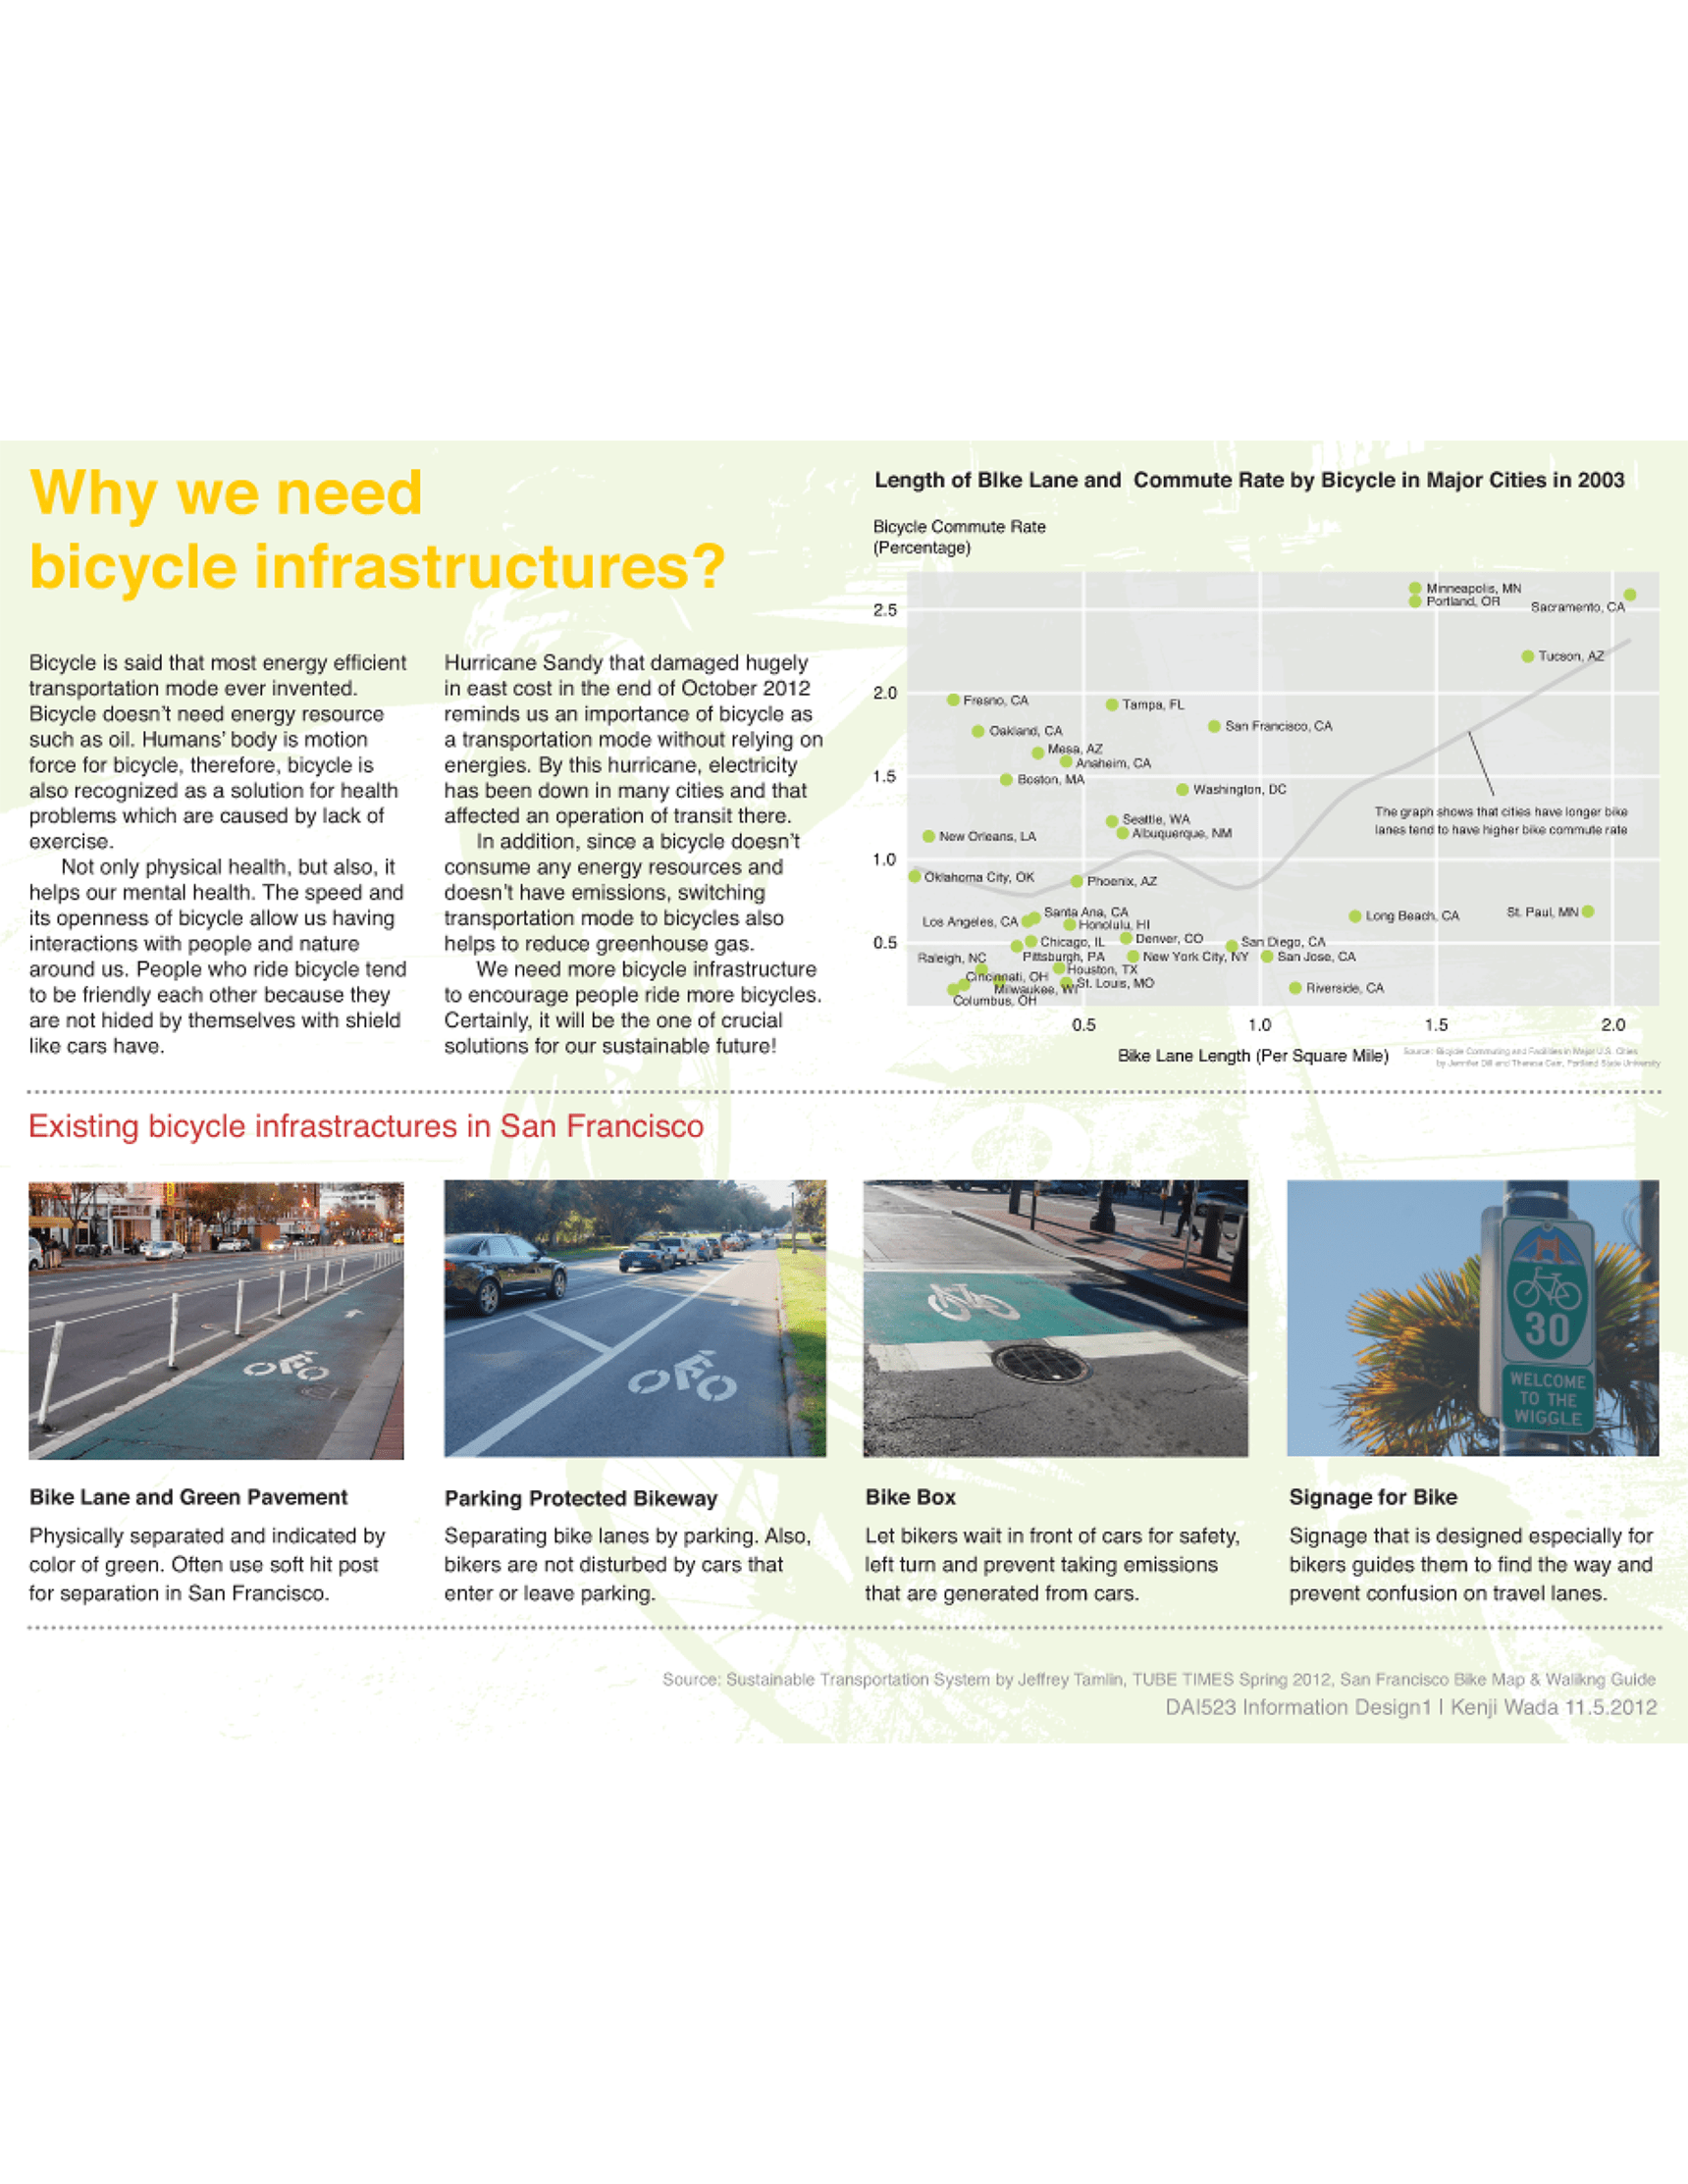
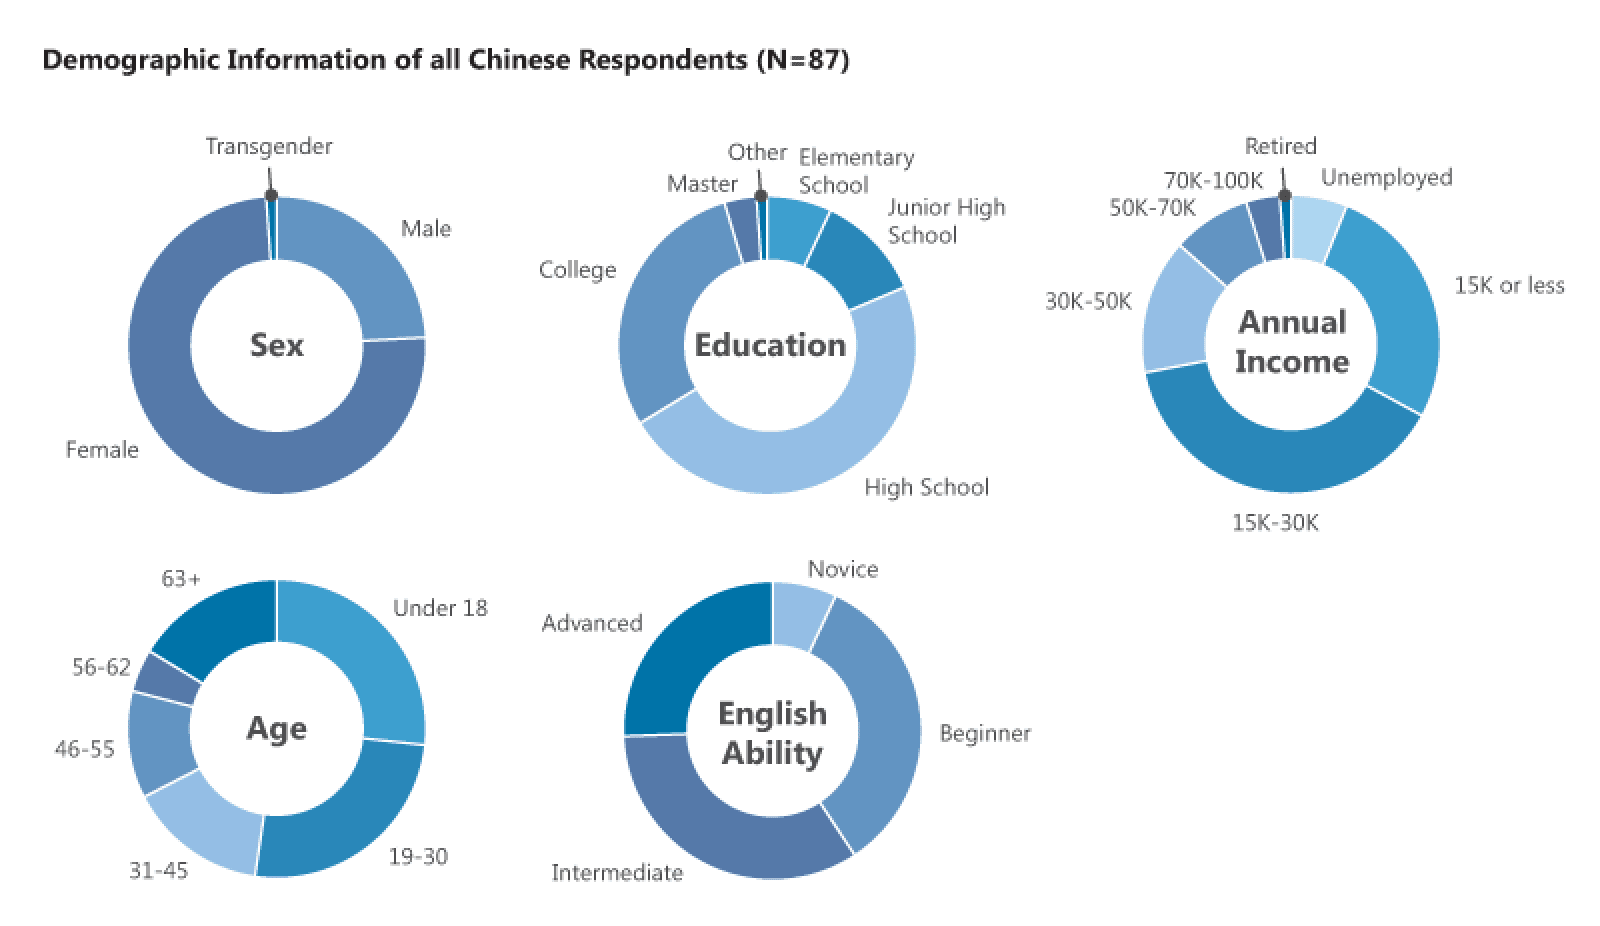
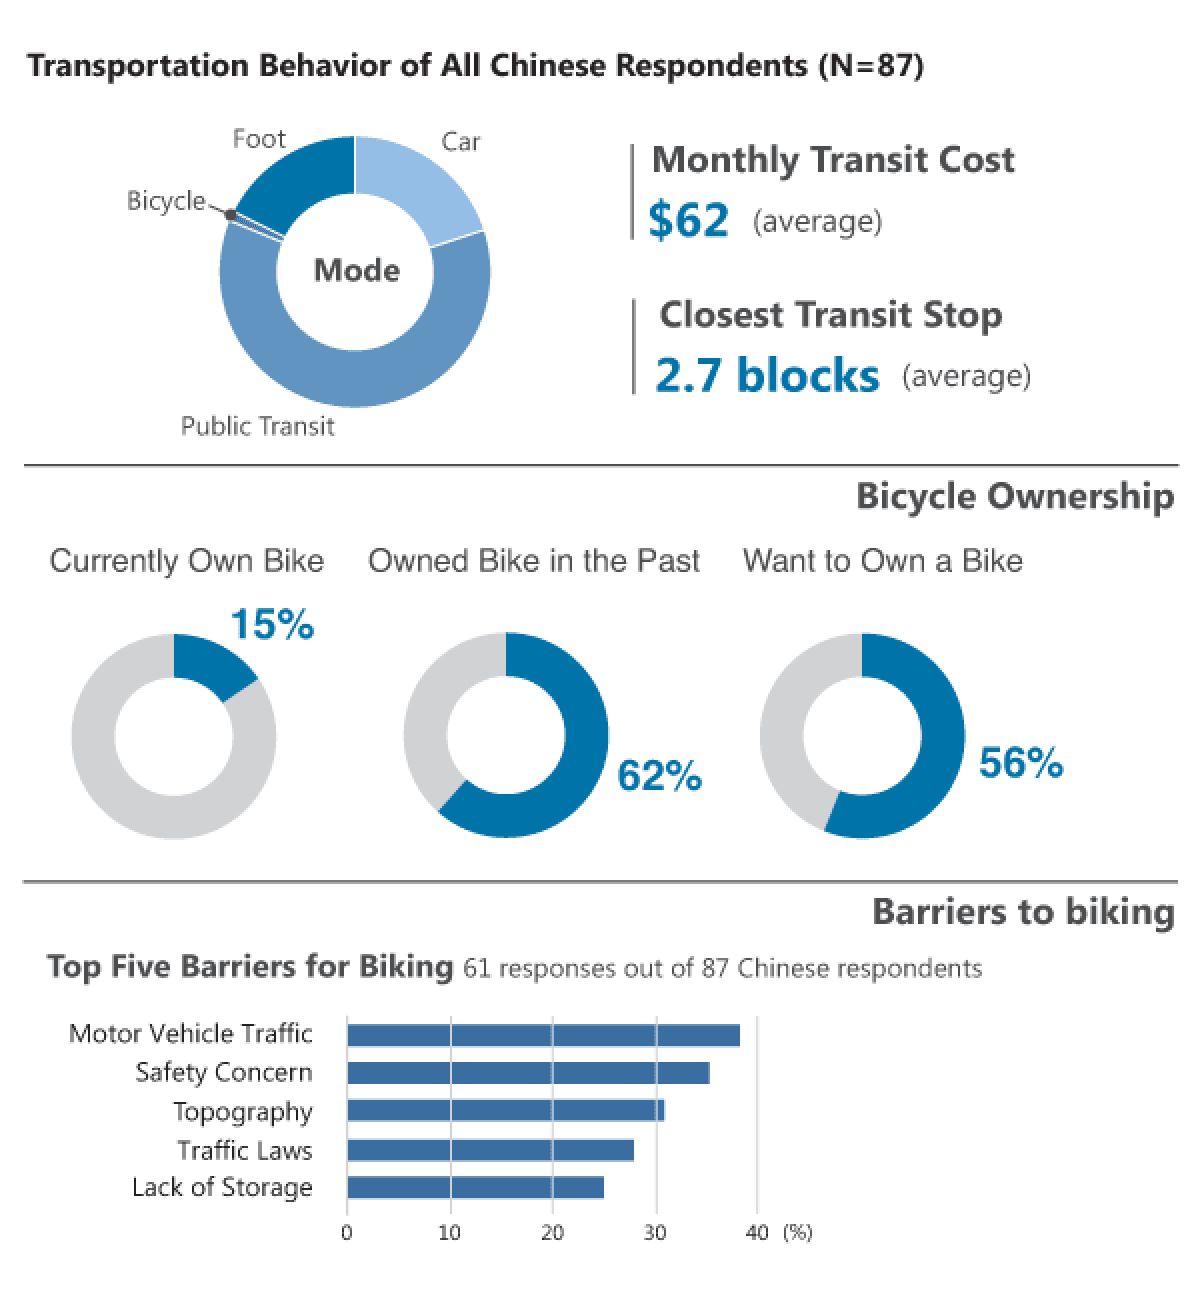
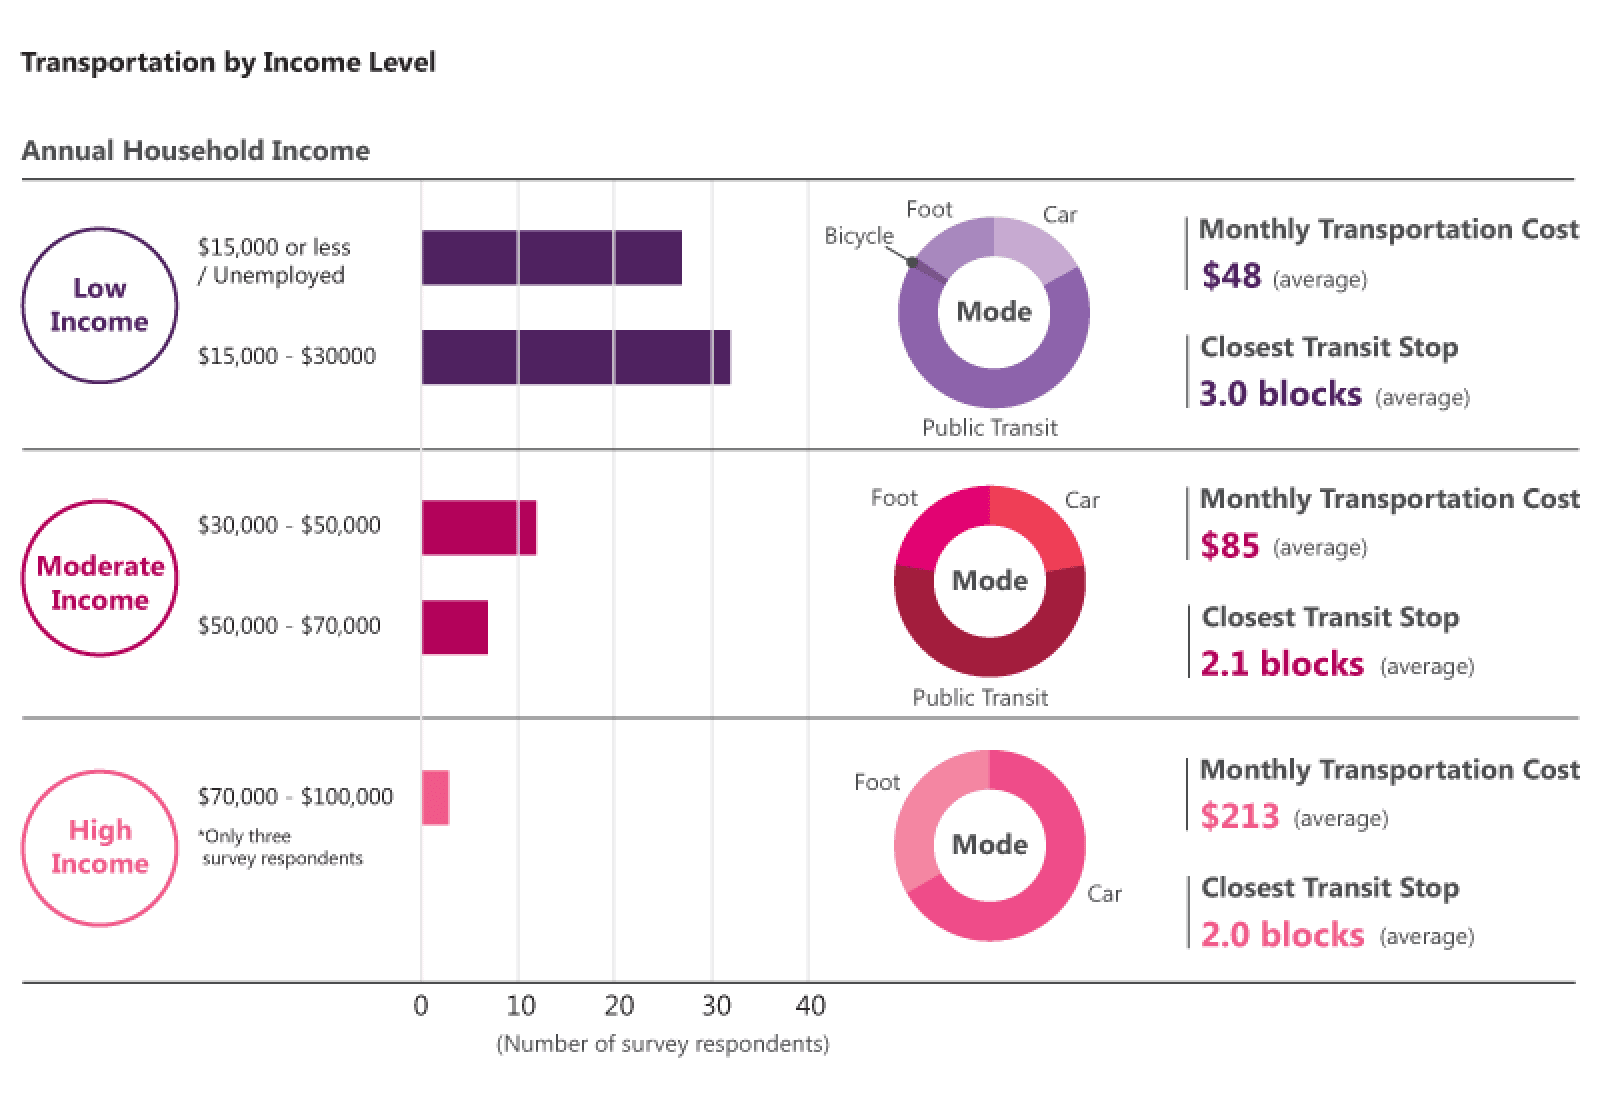
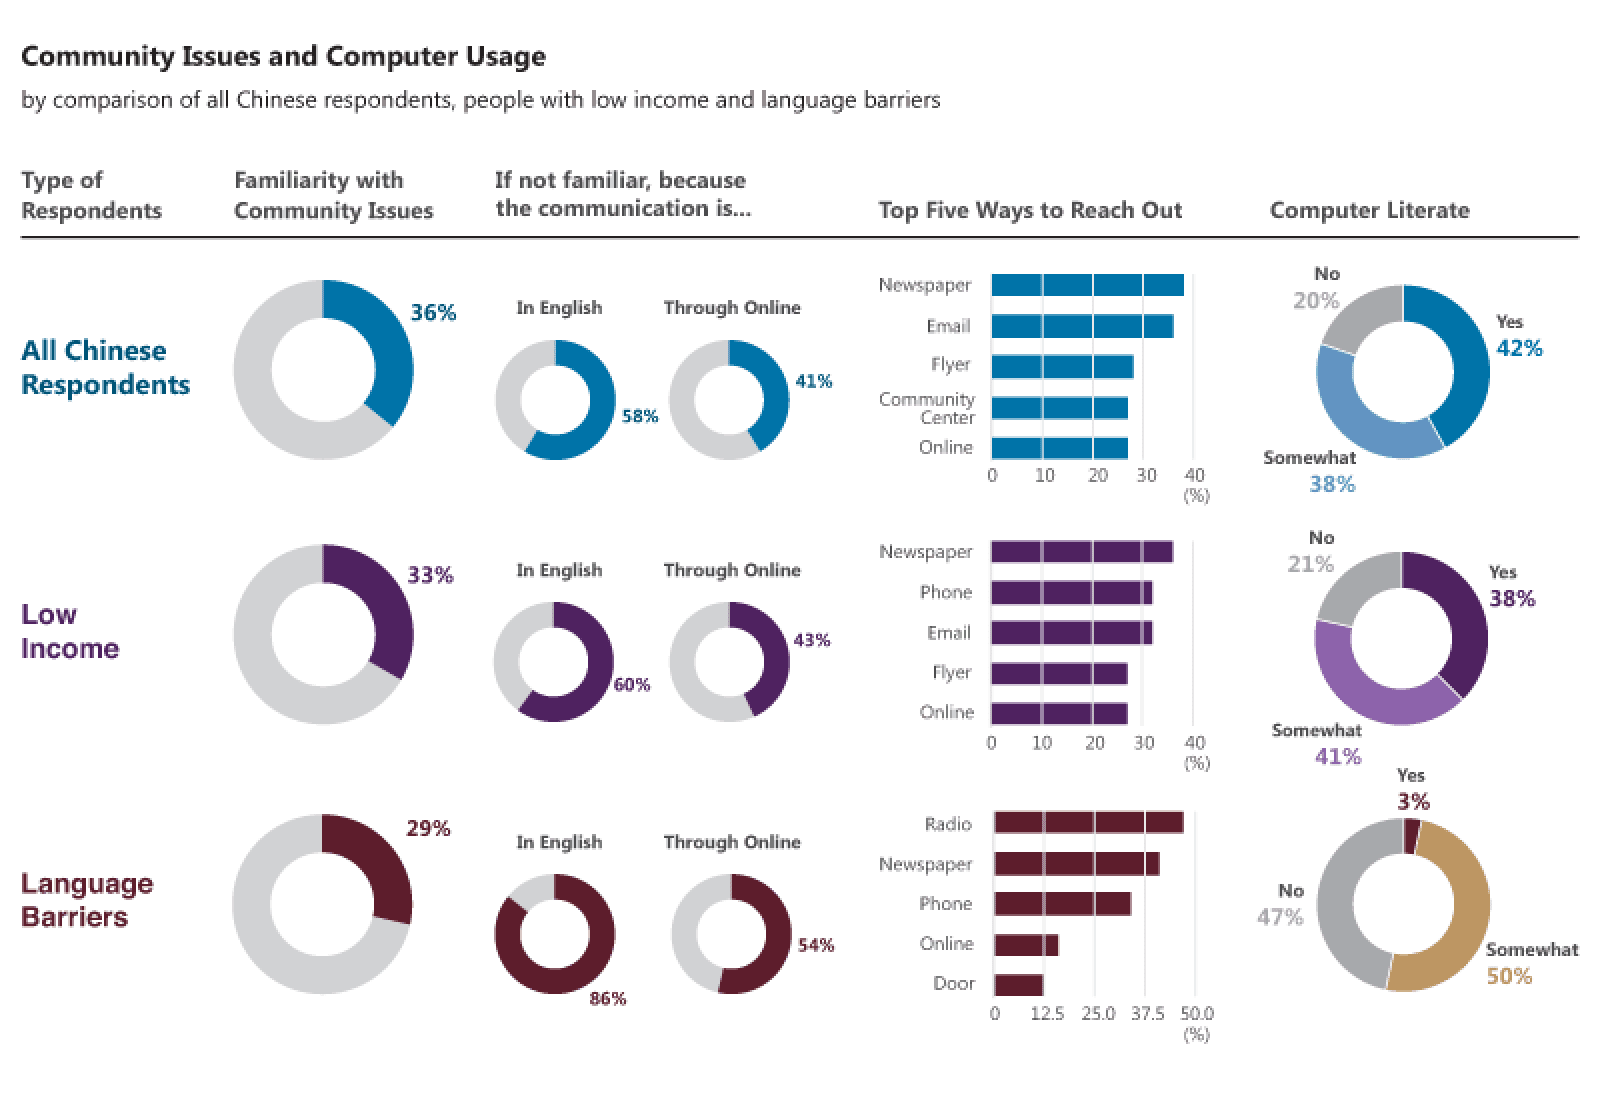
Information Designs
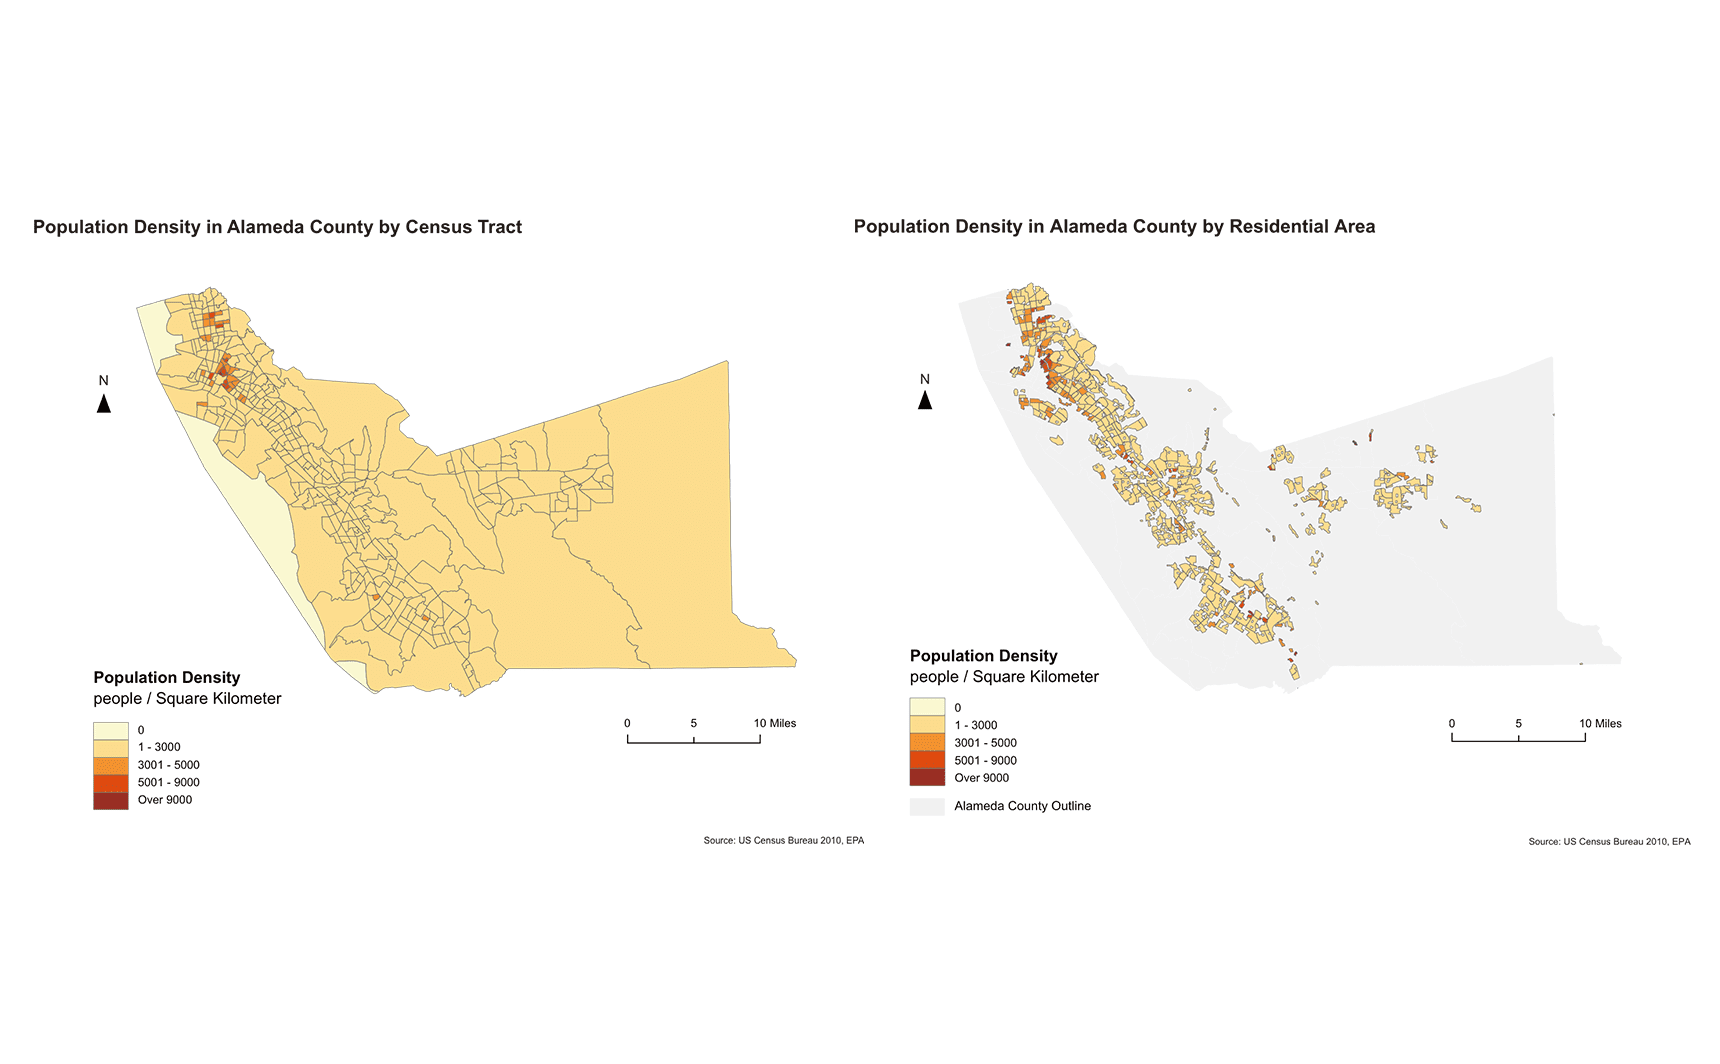
Variety of information designs done for courses at San Francisco State University. Most of works has done by the combination of ArcGIS, R, Illustrator, and Photoshop.
Illustrator · ArcGIS · R · Photoshop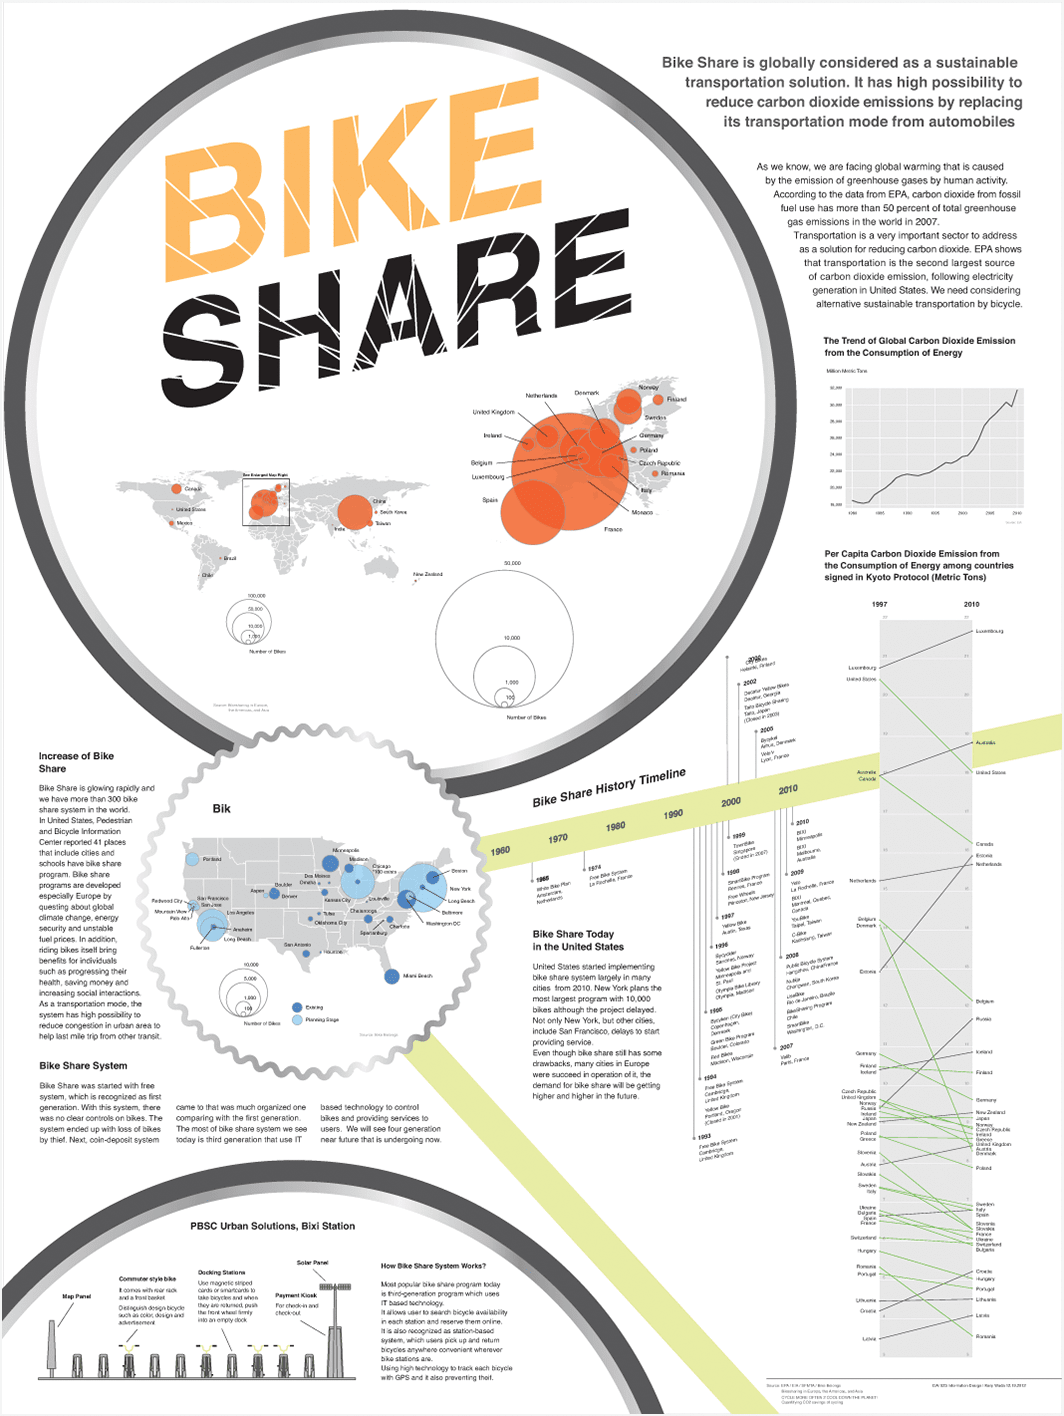
Bike Share Poster
Data visualizations and information graphics about Bike Share designed for Information Design course at San Francisco State University. R is used for making data visualizations and Illustrator for cleanup and layout the visualizations. The shape of a bicycle is used as a frame/grid to layout the visualizations.
Illustrator · ArcGIS · R · Photoshop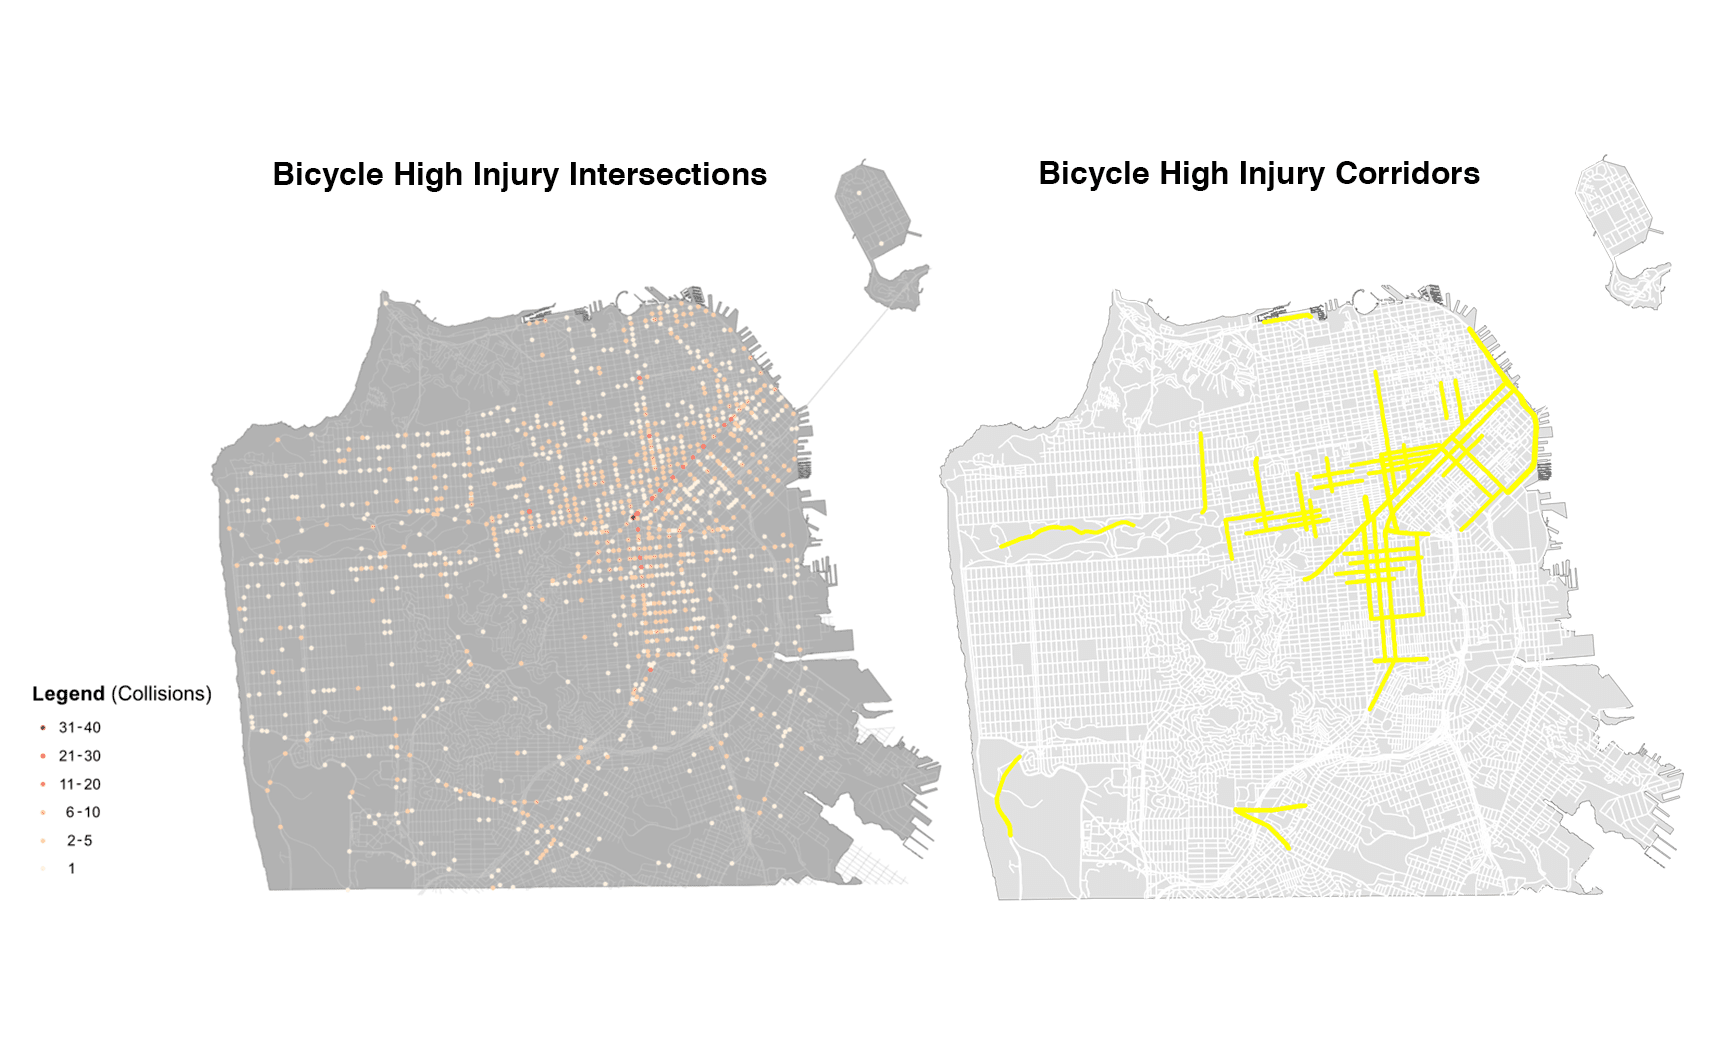
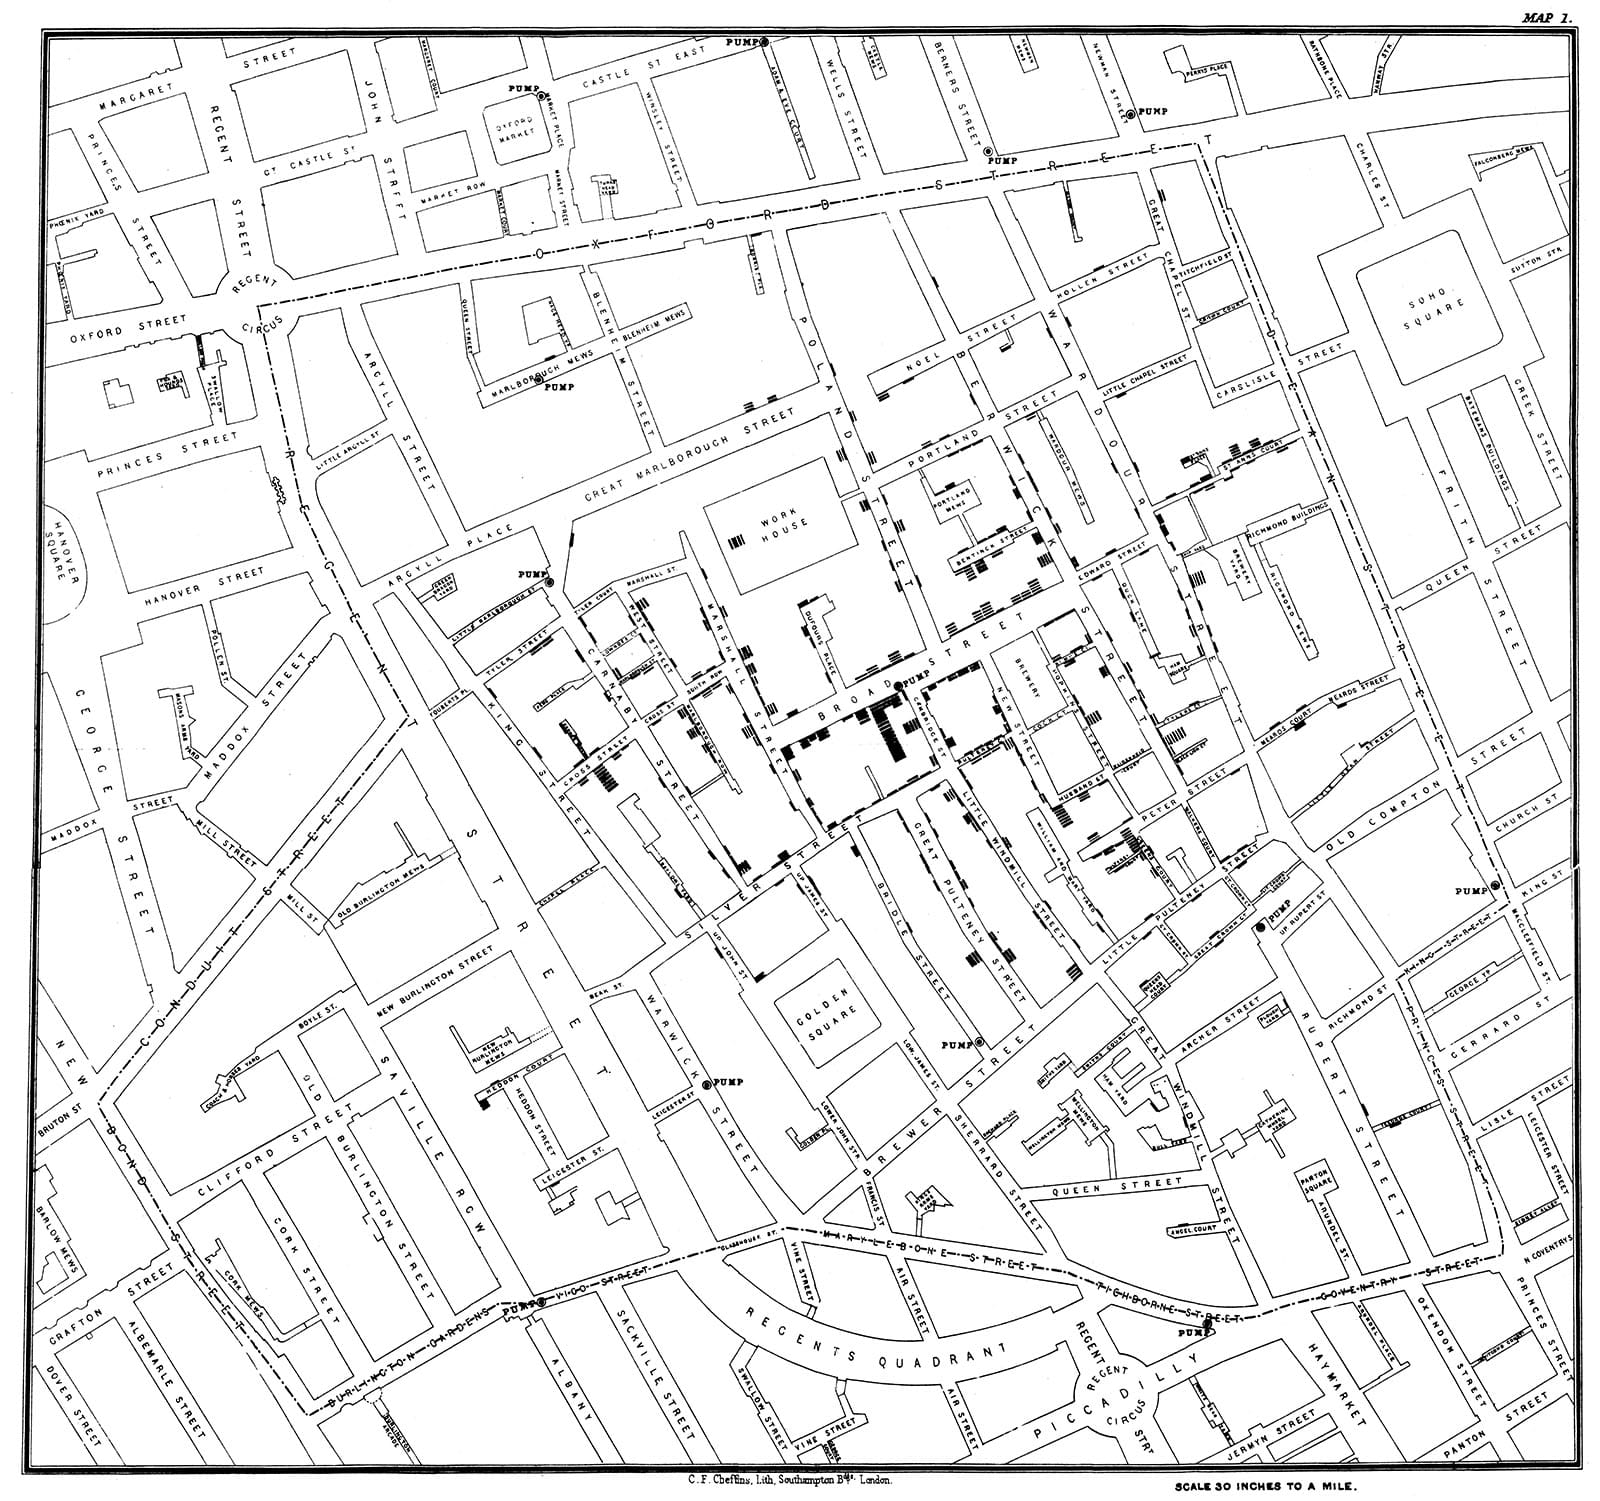
Cartographies
Several cartographies were created for various projects by using ArcGIS and Illustrator.
ArcGIS · R · Illustrator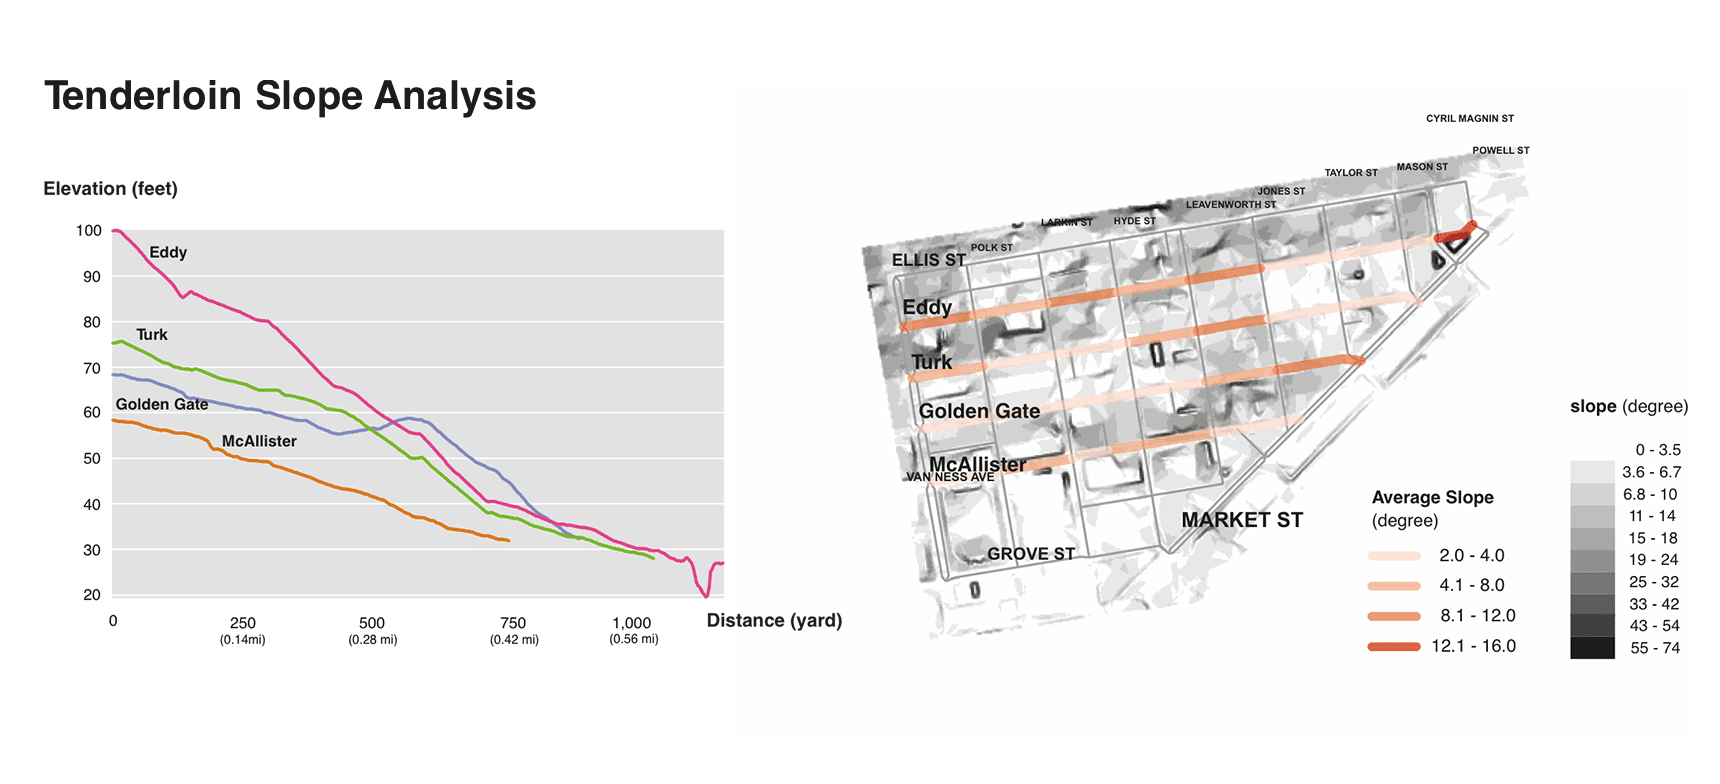
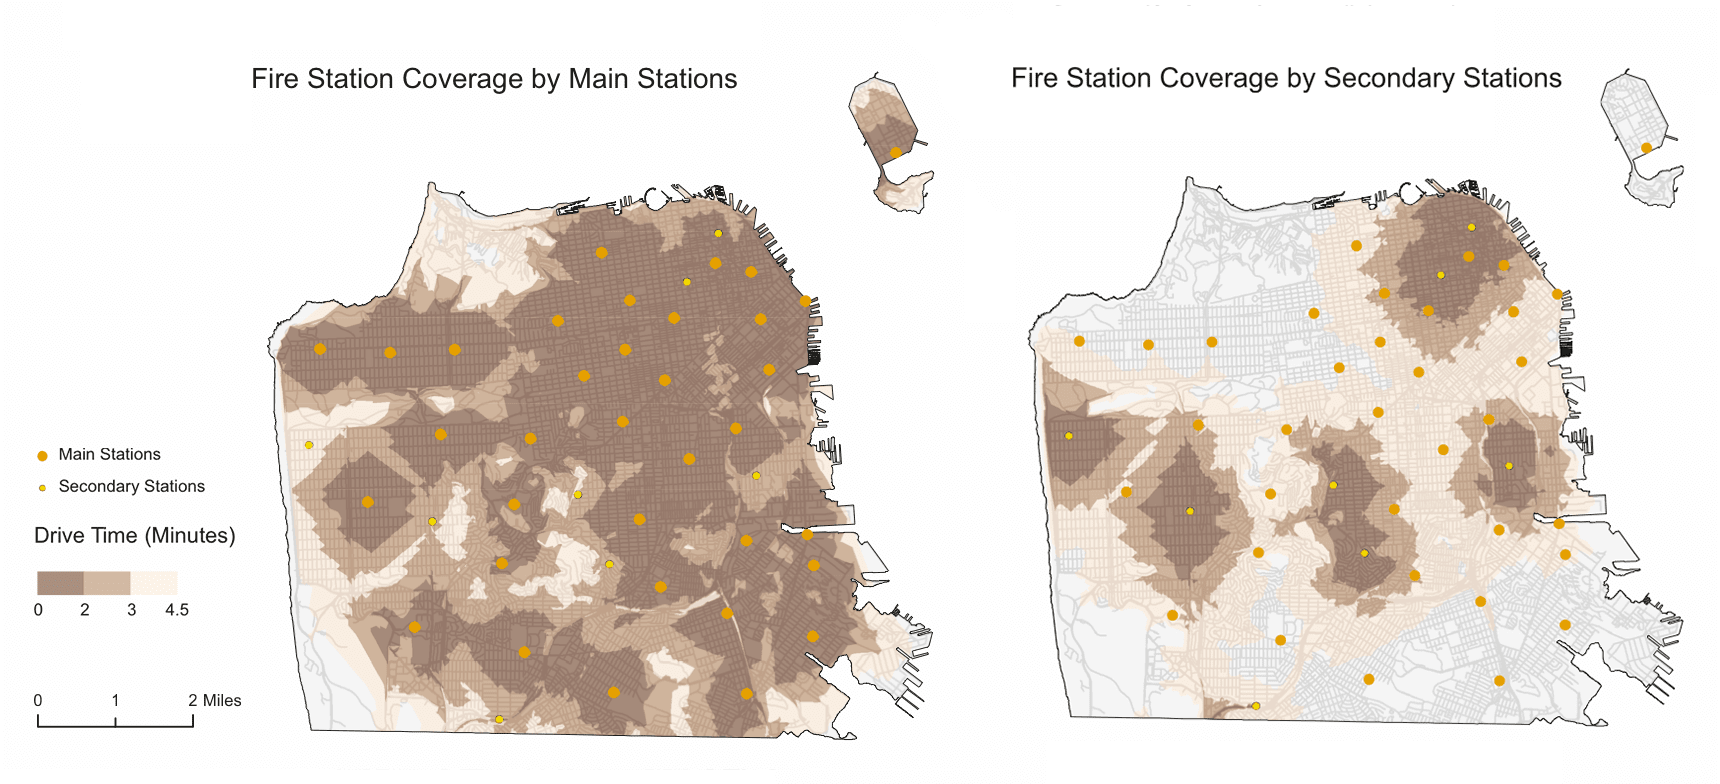
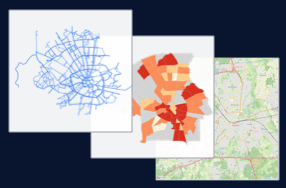
Spatial Analysis
Examples of spatial analysis (slope analysis, hillshade, and network analysis) done for several projects.
ArcGIS · R · Illustrator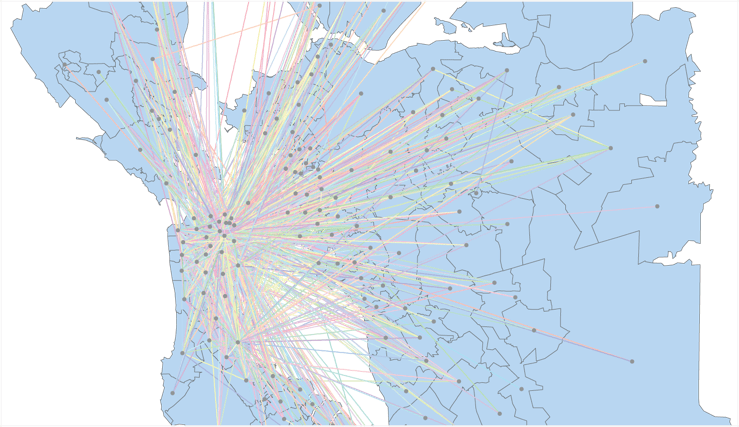
Commute Patterns
SF Bay Area
This is an experimental project done by using mainly ArcGIS. I was asked to visualize communicating patterns in the San Francisco Bay Area based on a survey data. The survey data contained zip code of respondents’ homes and also their work locations.
ArcGIS · R · Illustrator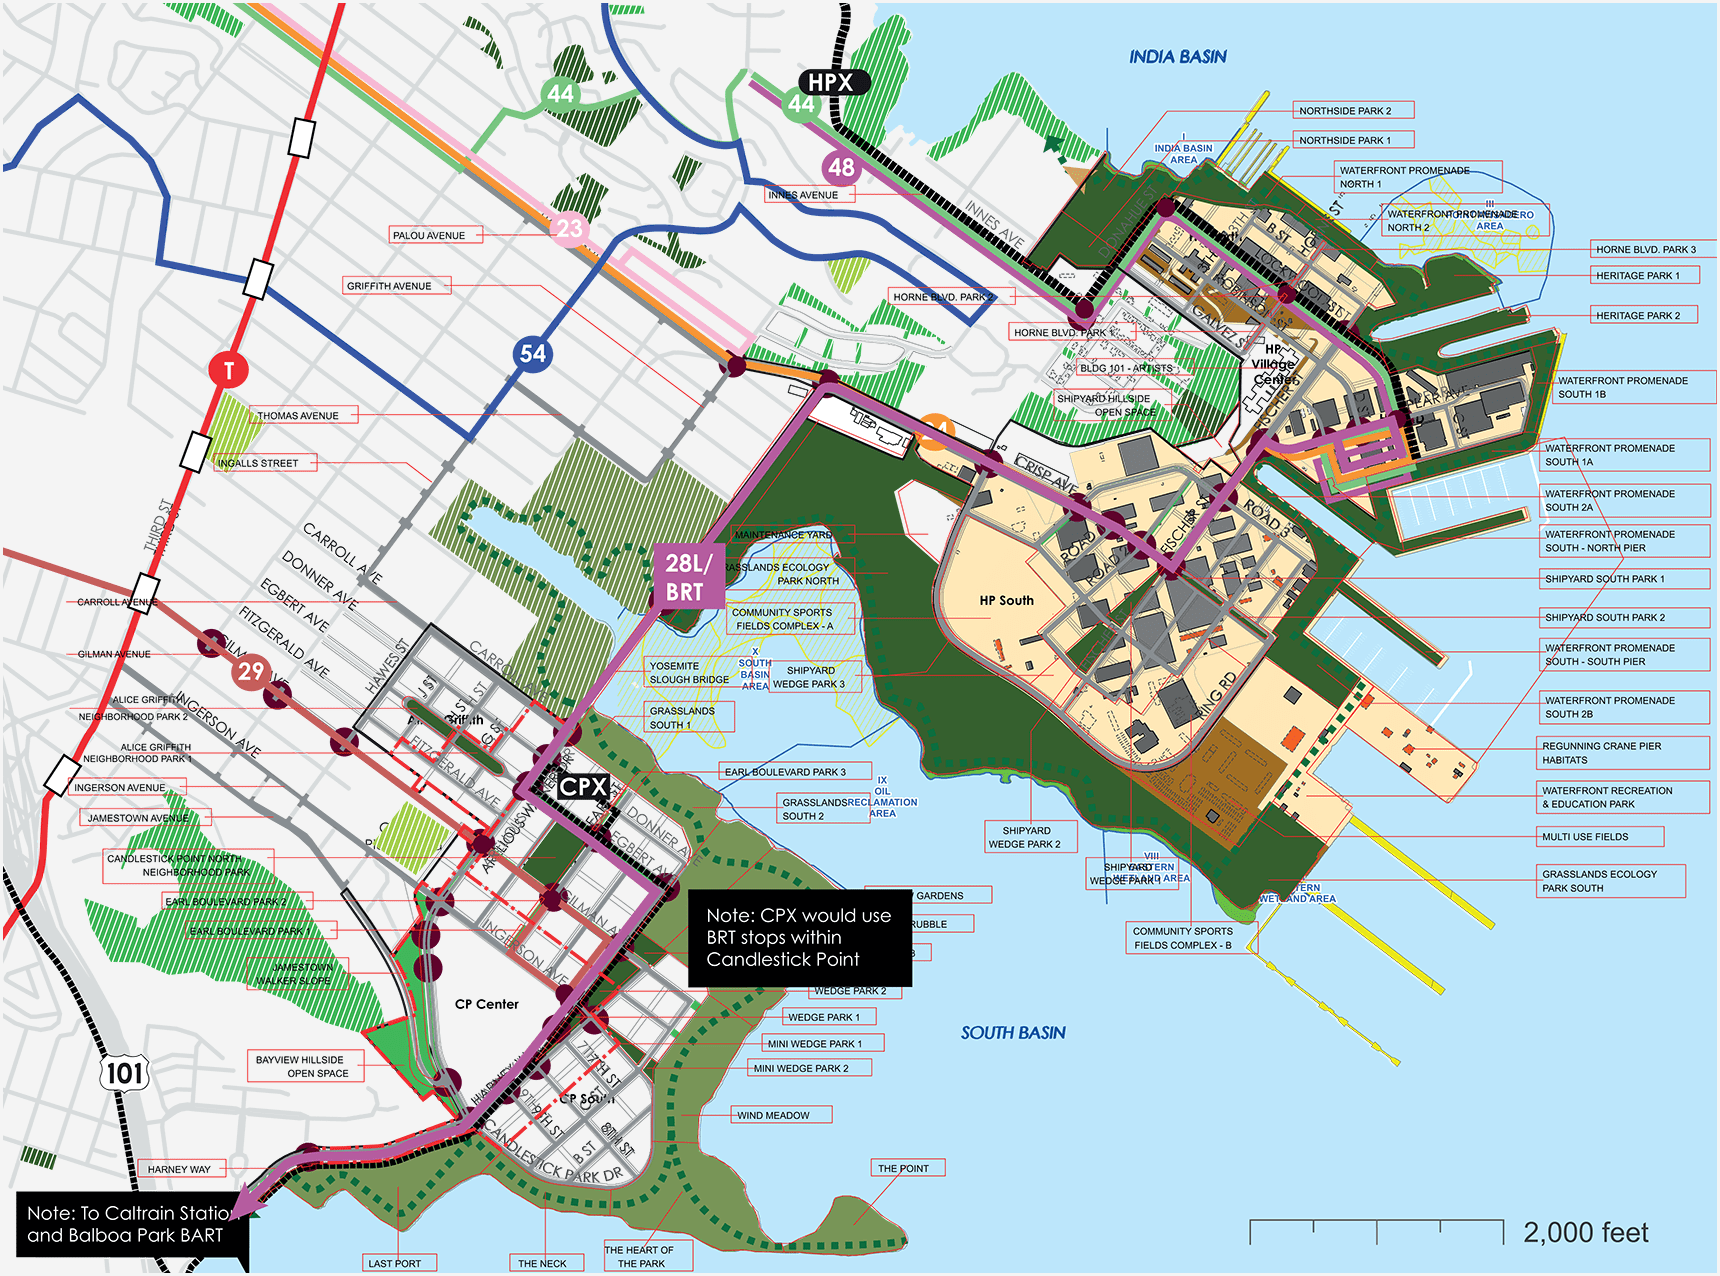
Bayview Development
For a massive development plan in the neighborhood of Bayview in San Francisco, I compiled GIS data received from many different sources. The compilation of GIS data was also exported in a way that non GIS users are also able to use (Adobe Illustrator format with separate data layers).
ArcGIS · Illustrator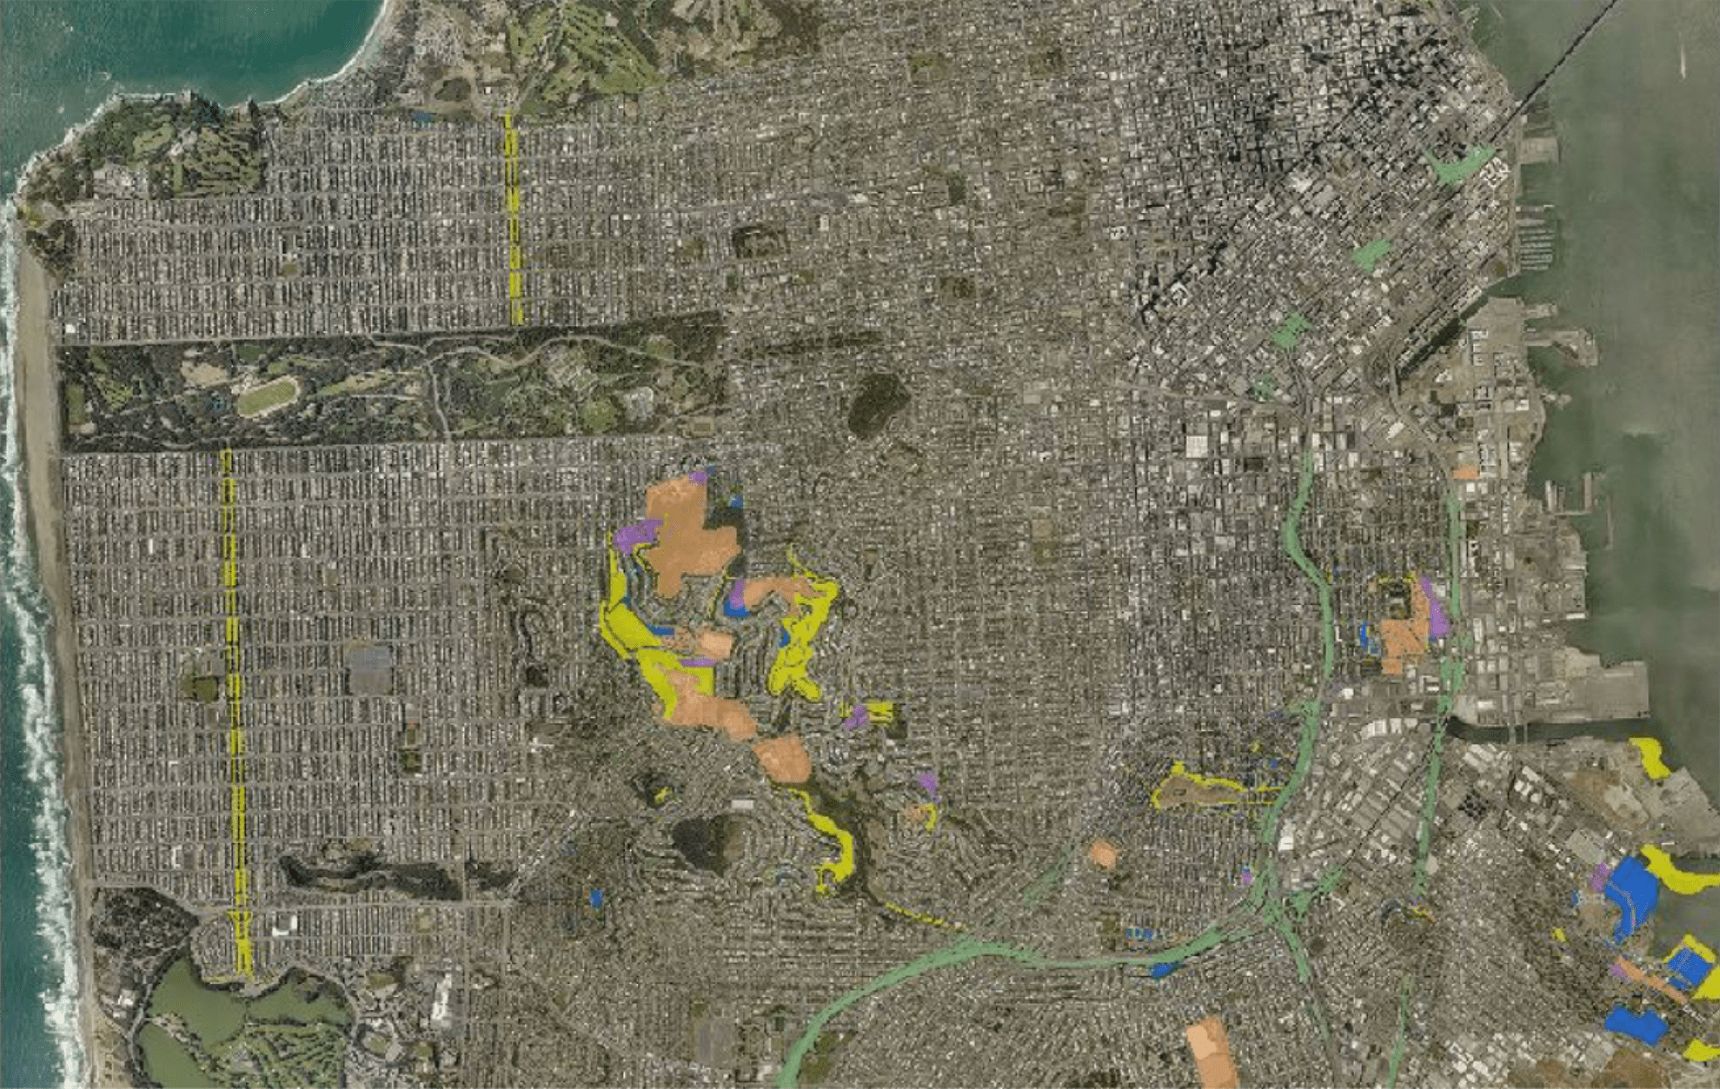
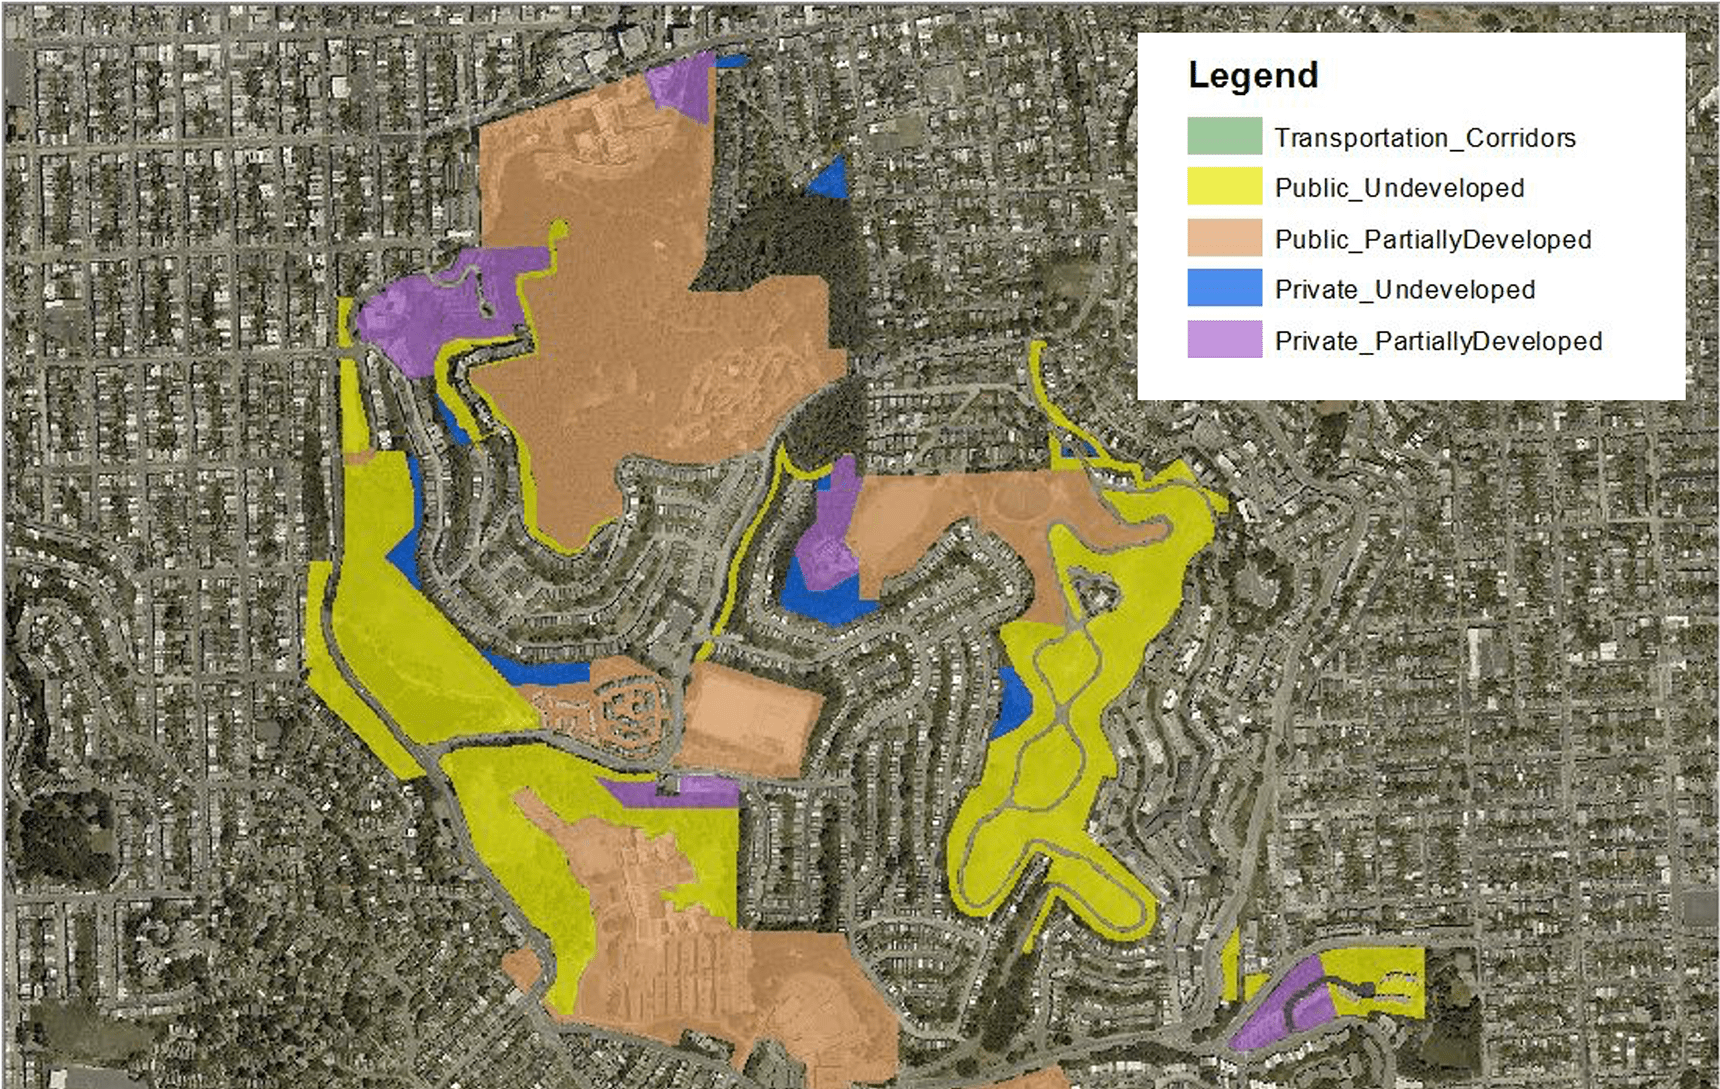
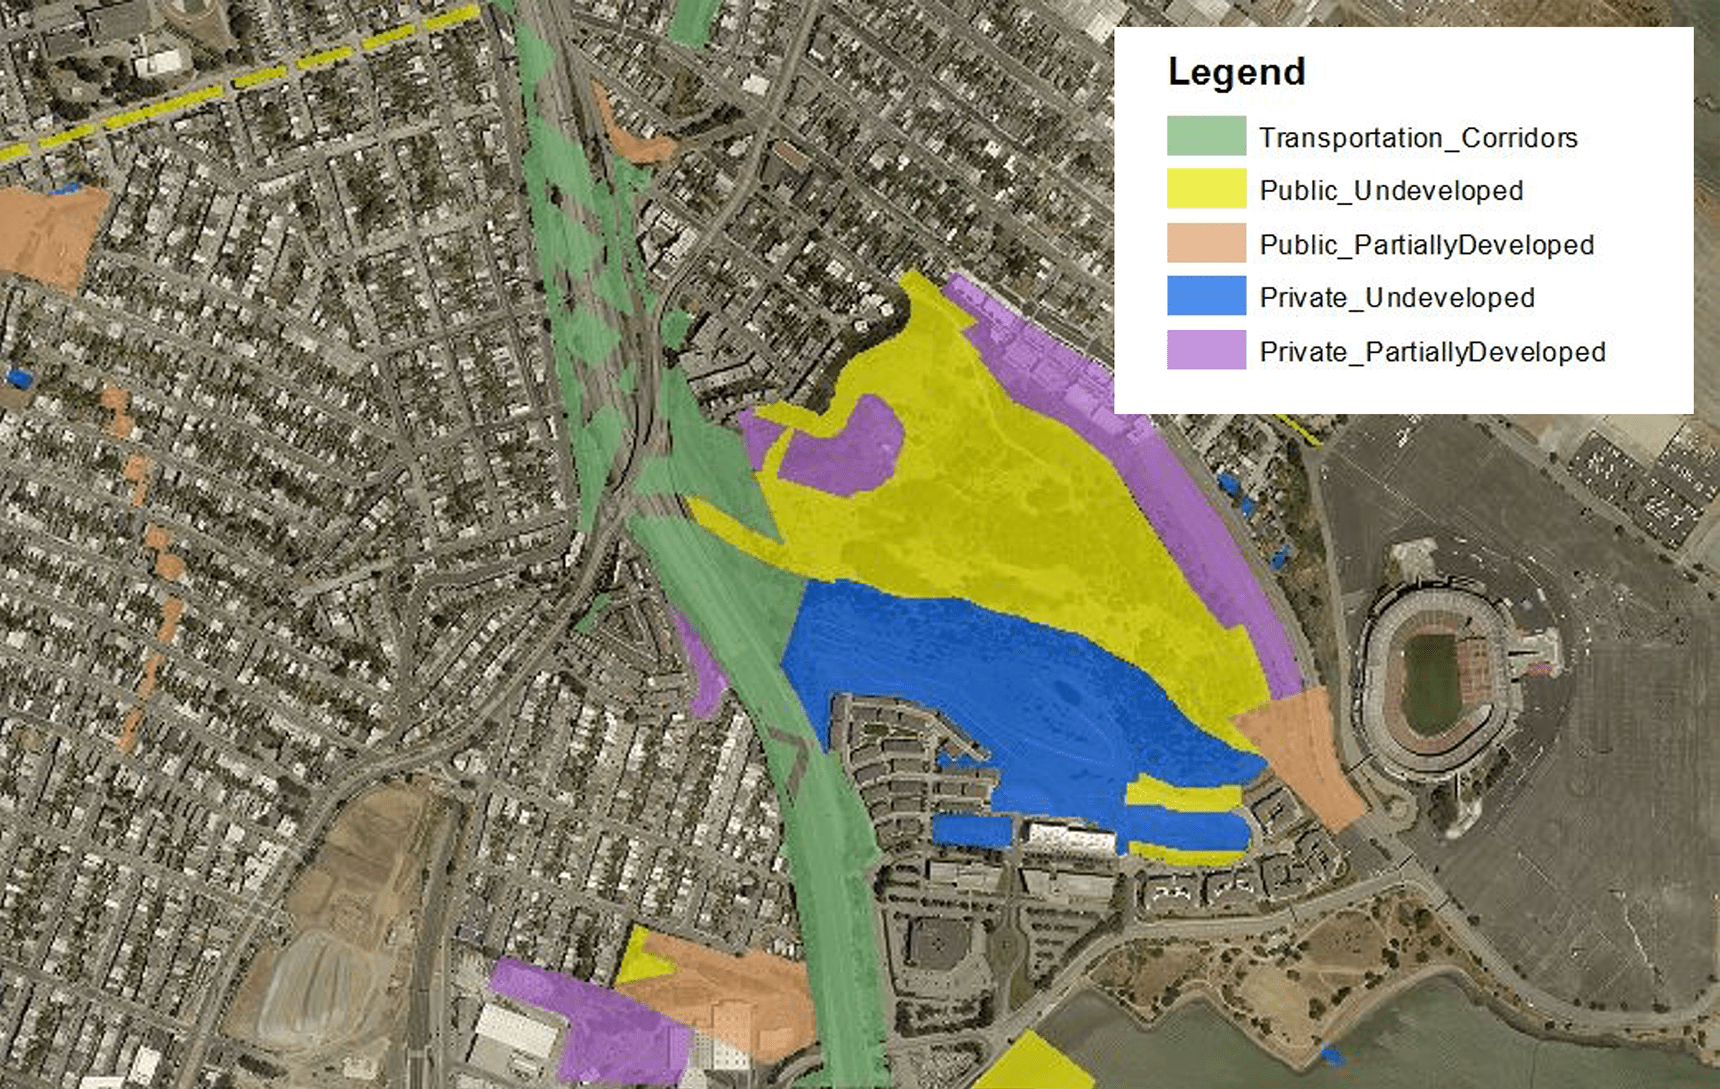
Biodiversity GIS Data
Looking at parcels in the city, I created the GIS data (shapefiles) showing potential habitat (unused land) by using ArcGIS collaborating with the other intern for the Department of Environment in San Francisco.
ArcGIS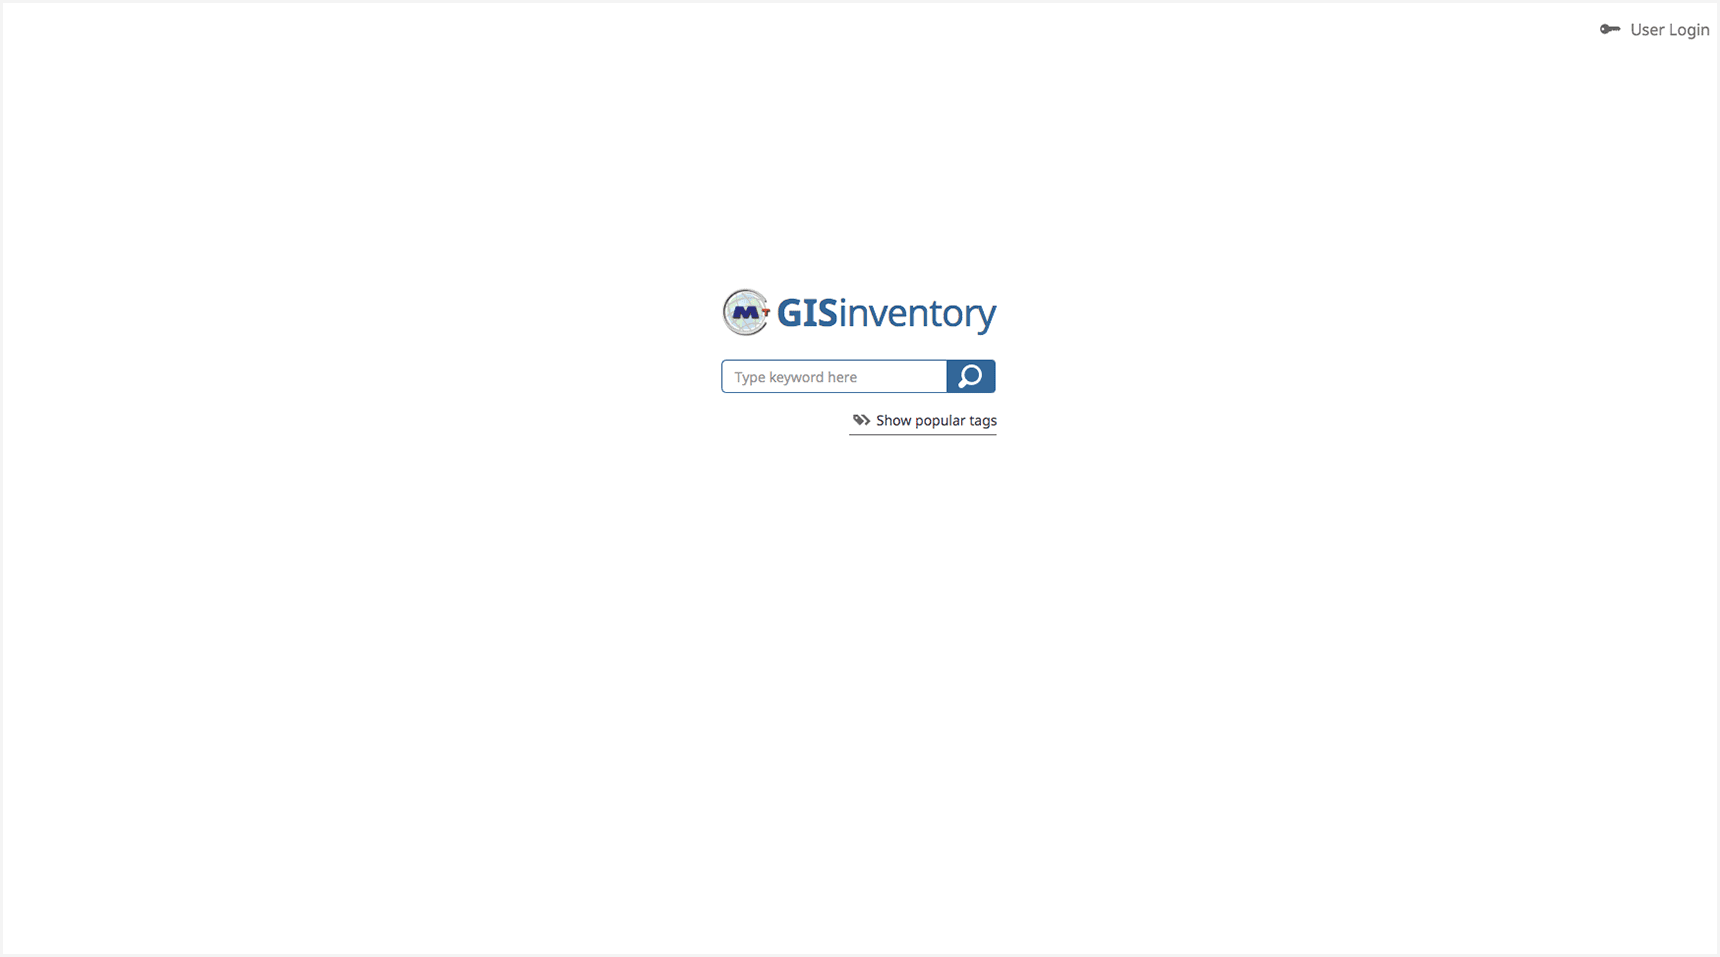
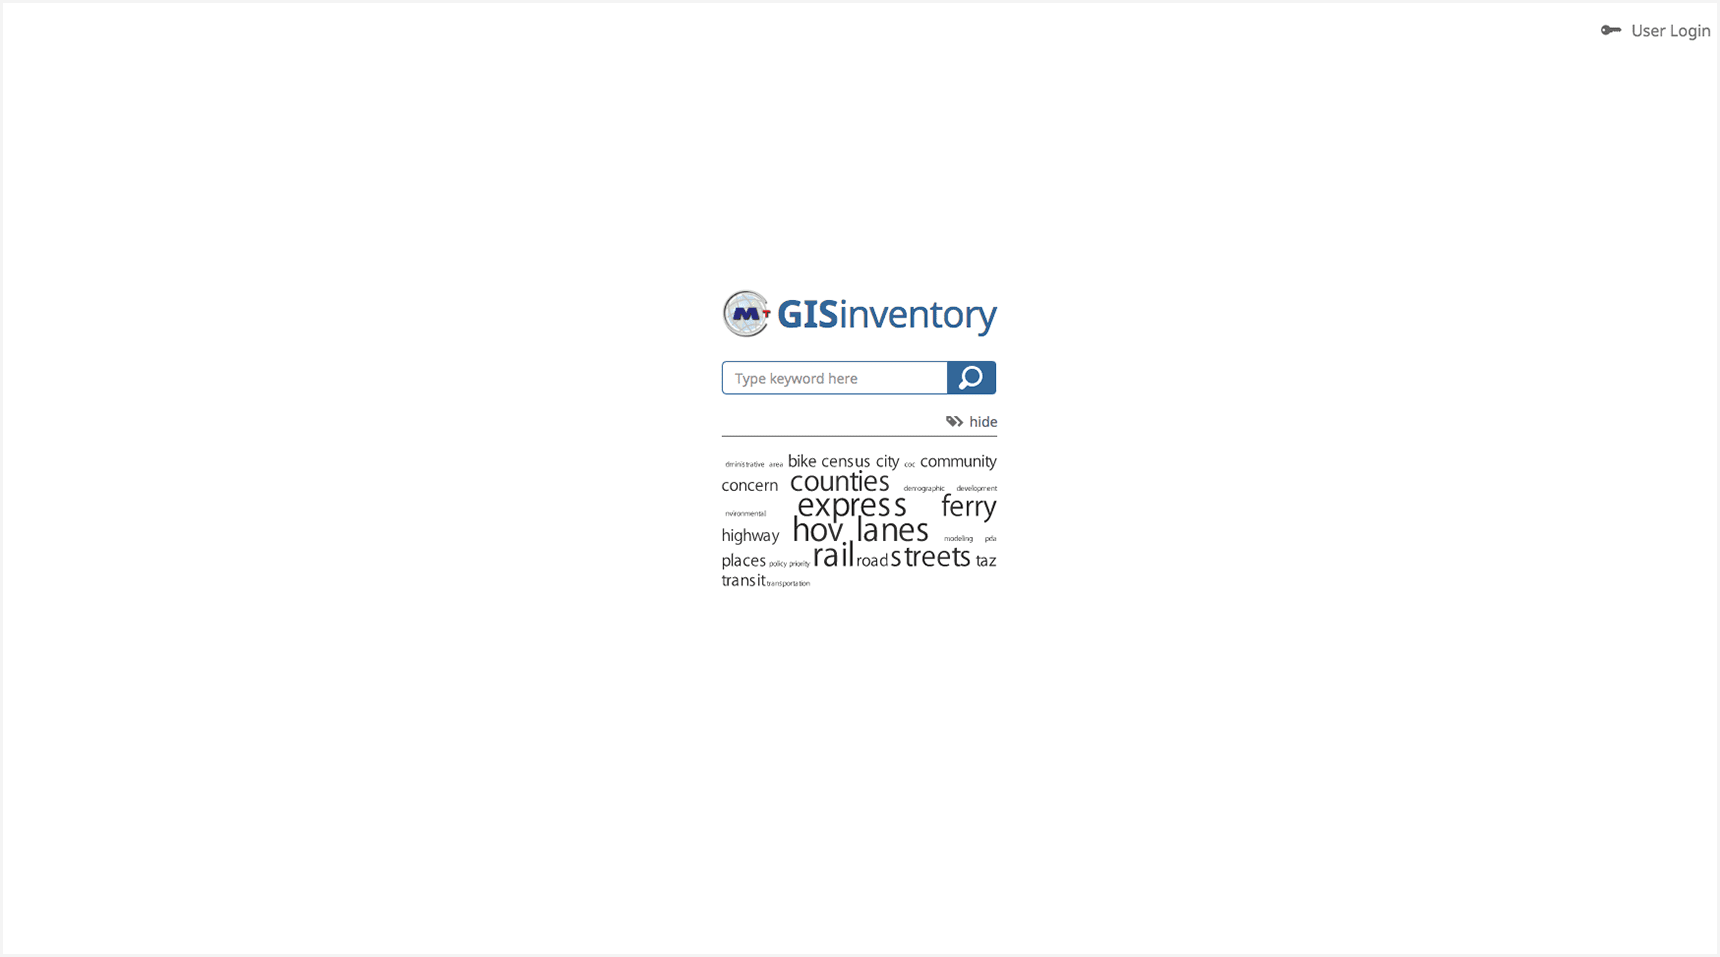
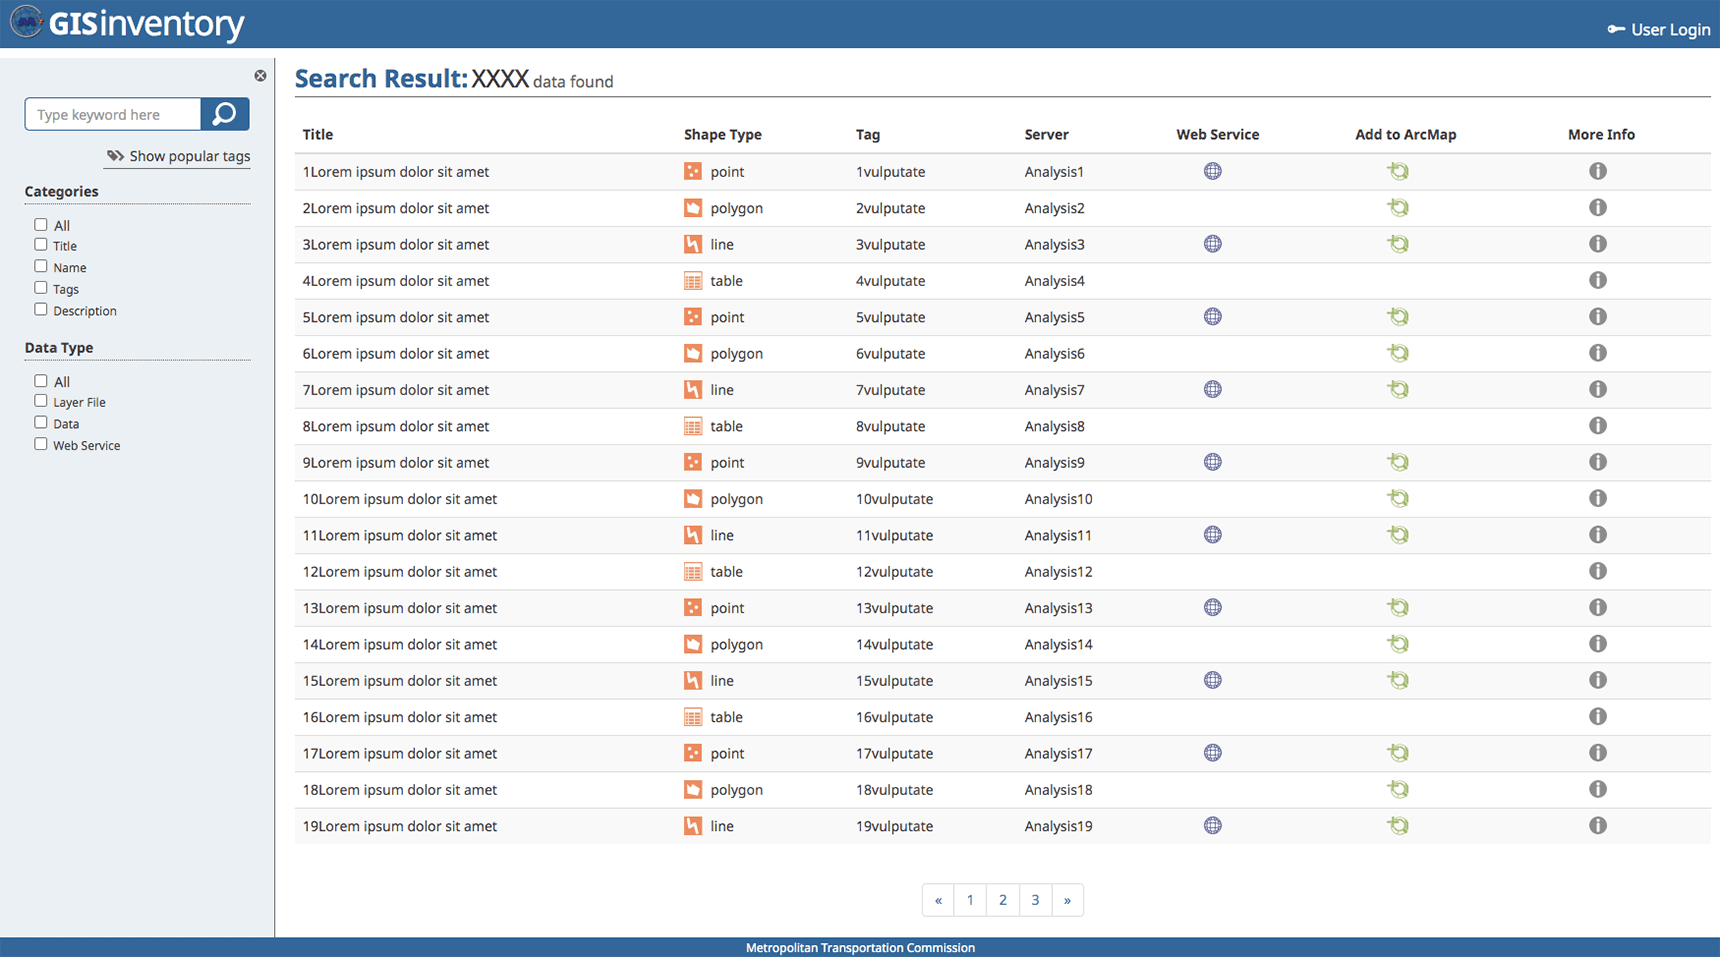
GIS Inventory
This is a project to design and develop an internal inventory of GIS datasets for MTC (Metropolitan Transportation Commission). To make the search easier, Google-like simple search window was considered with the implementation of the tag clouds to see the popular datasets.
HTML · CSS · JavaScript · Illustrator · Photoshop
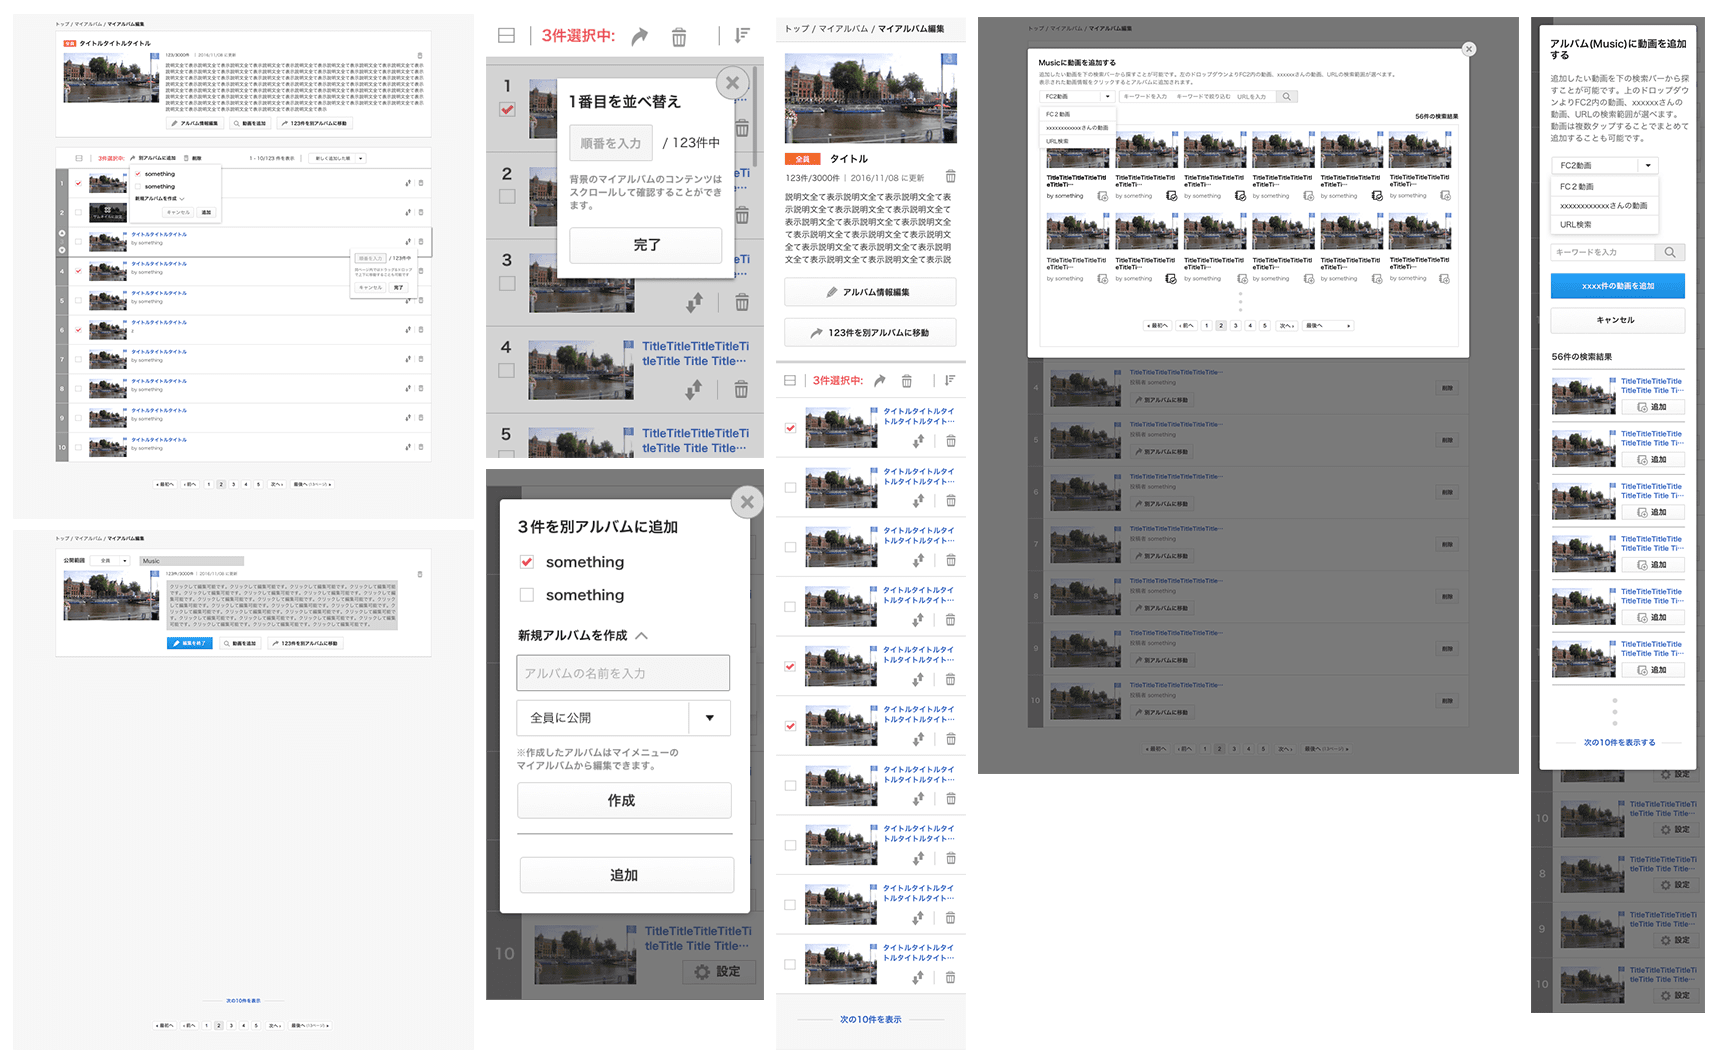
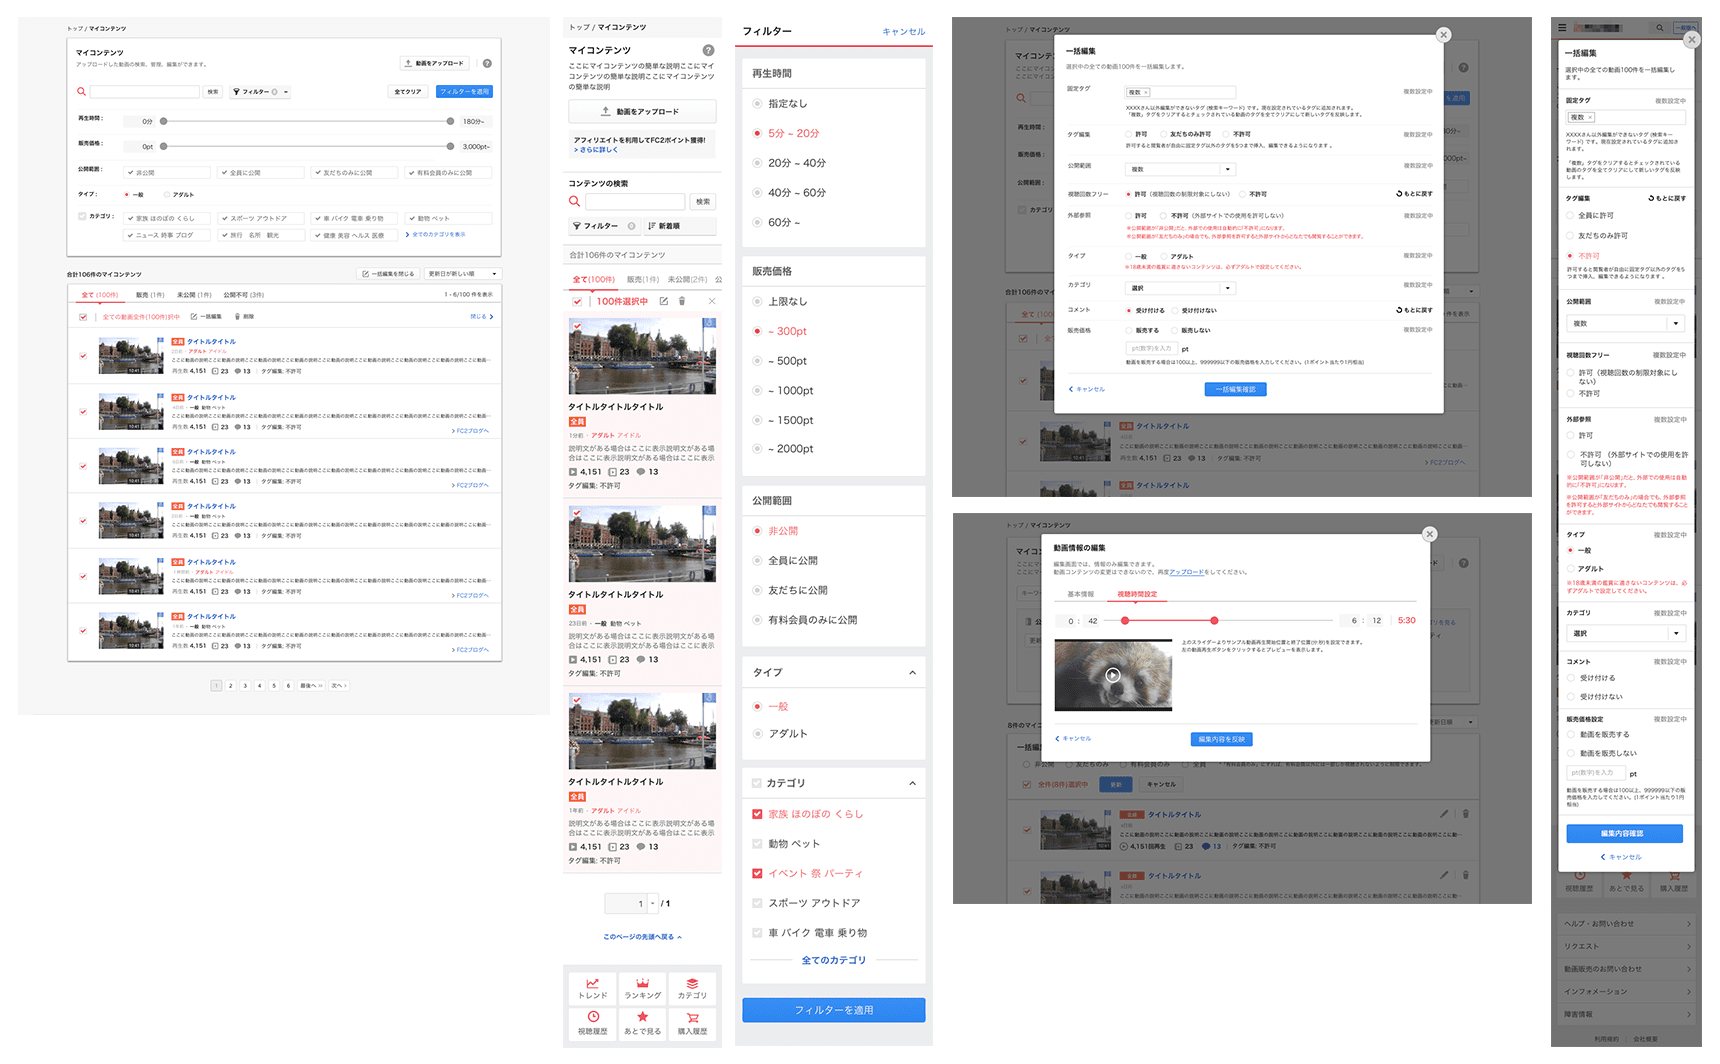
Account Pages for Video Streaming Service
These account pages were designed and developed (only front-end) for a video streaming service. These pages include users' profiles, albums users created, and videos users own with several functions such as sort, order, filter, and upload videos.
Sketch · InVision · Zeplin · Illustrator · Photoshop · HTML · CSS · JavaScript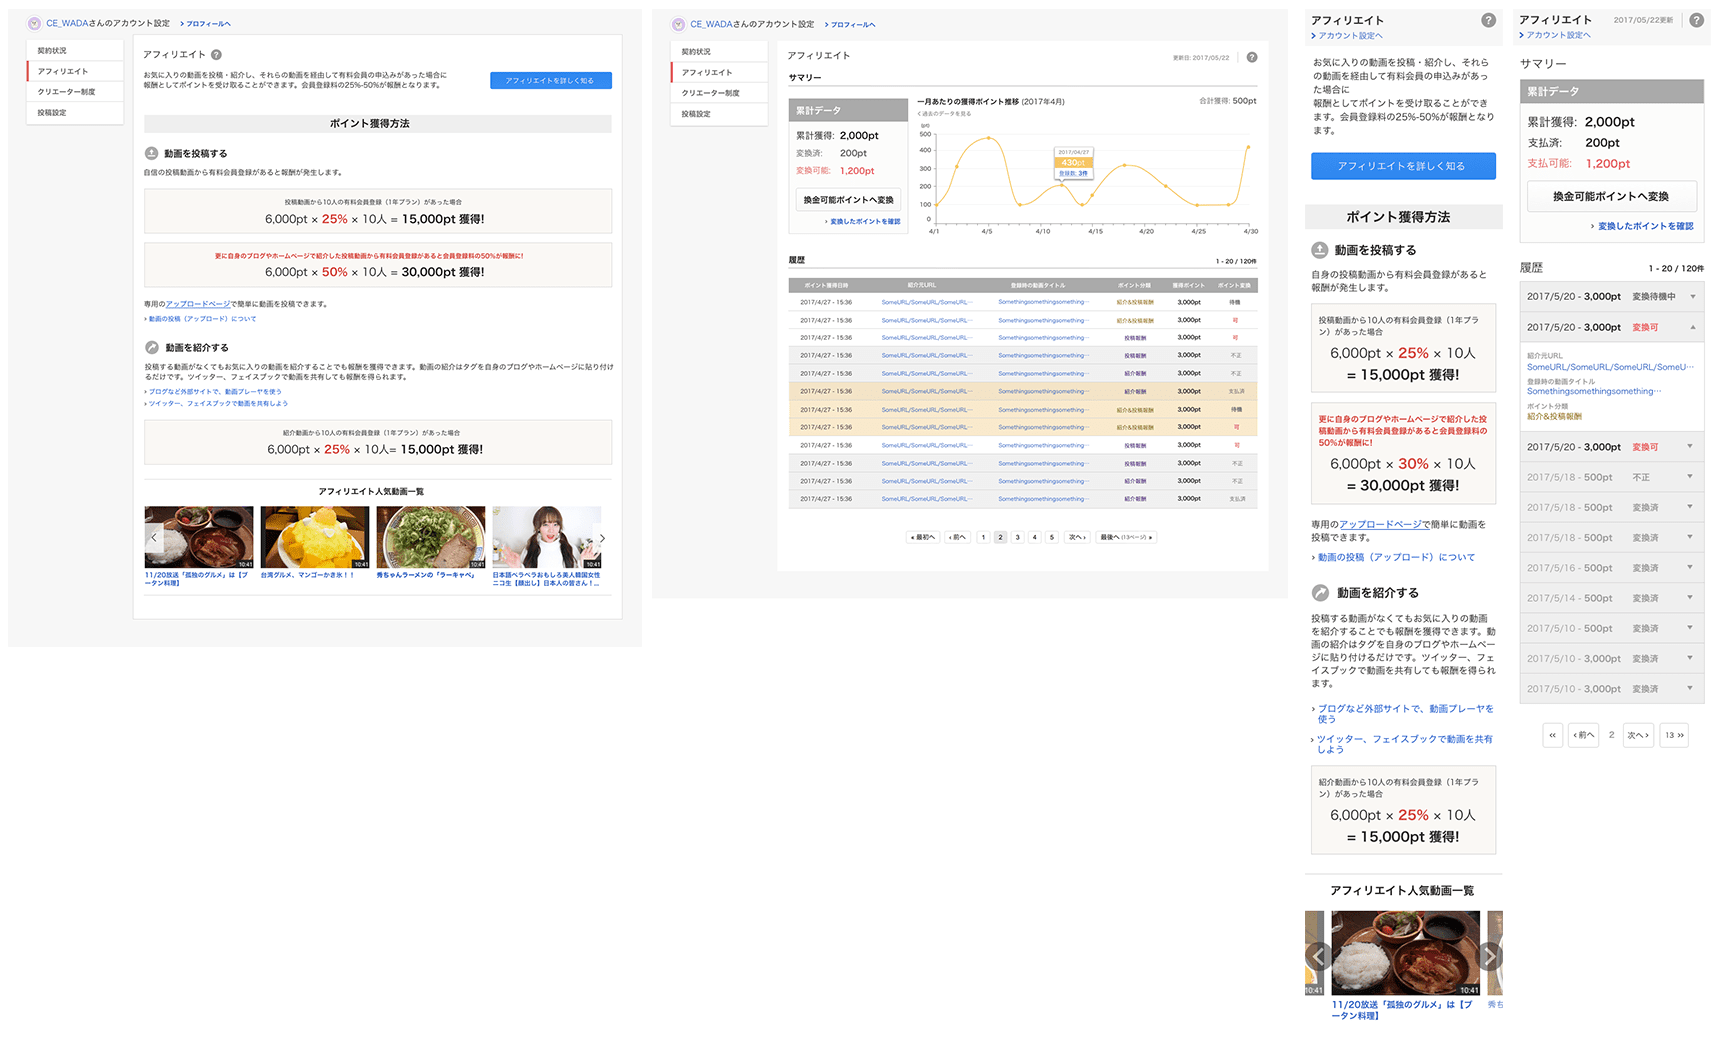
Affiliate Management
Affiliate management pages are designed and developed for users to see the income through an affiliate with a video streaming service.
Sketch · InVision · Zeplin · Illustrator · Photoshop · HTML · CSS · JavaScript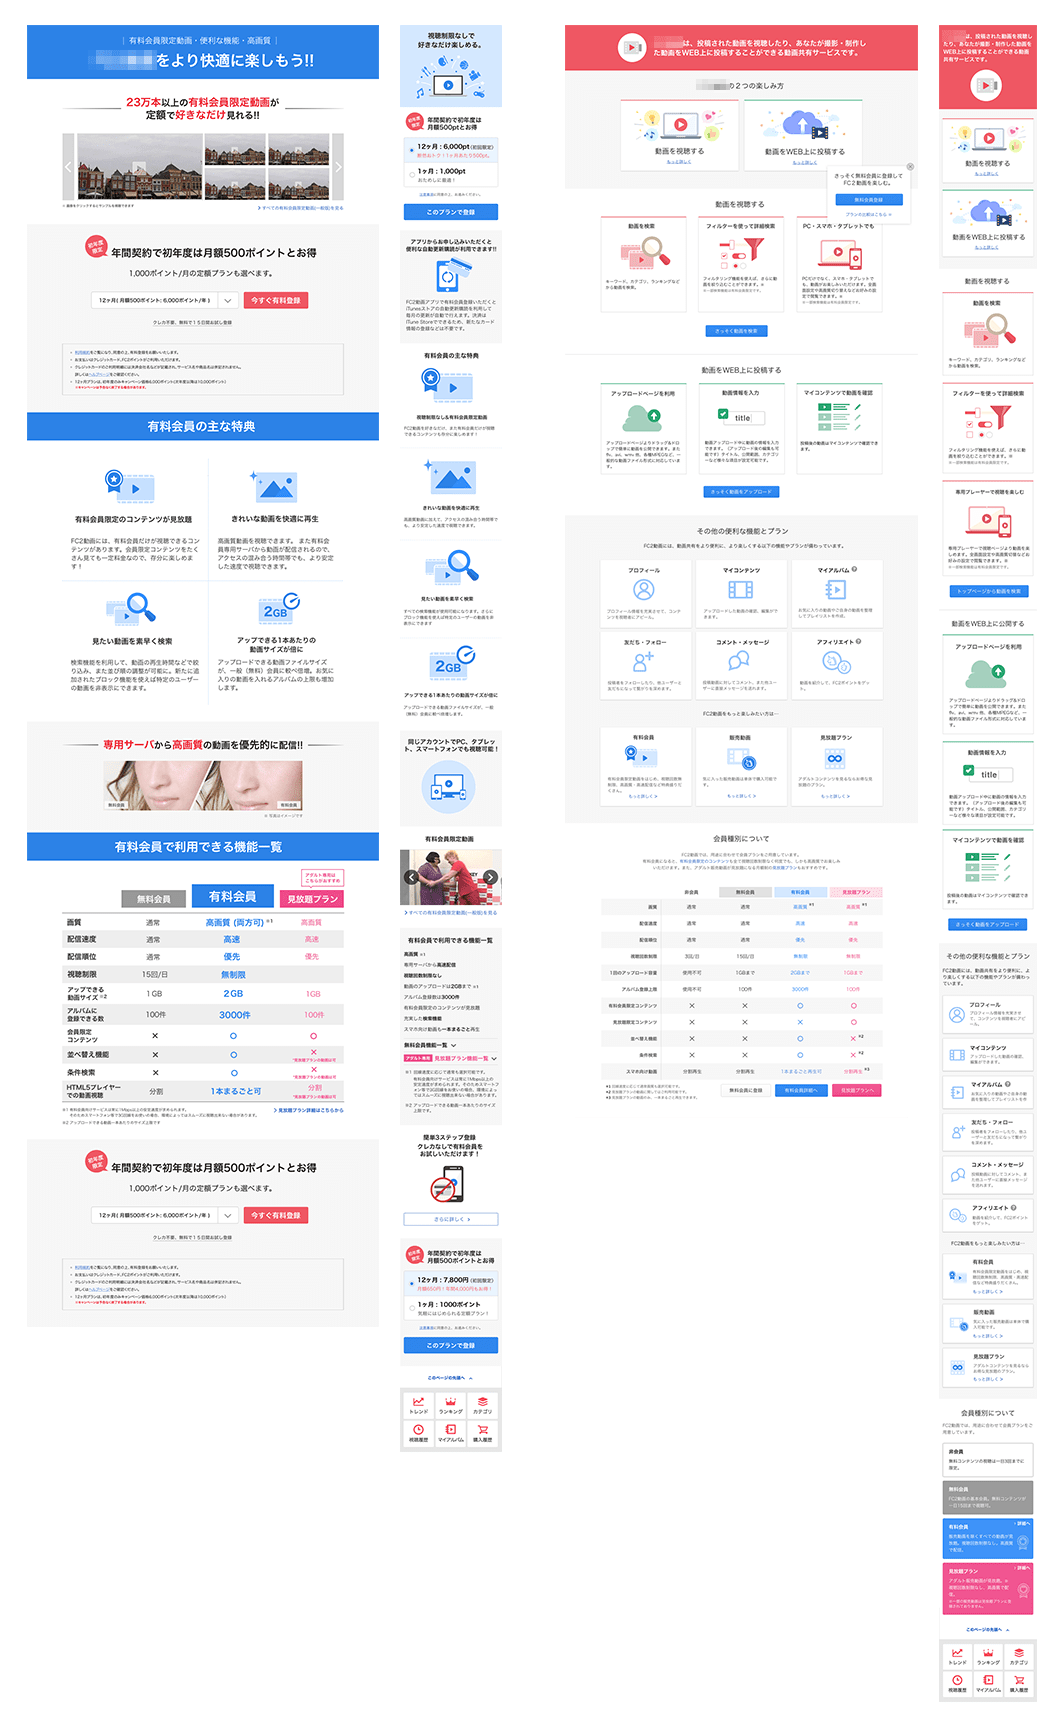
Landing Pages
Several landing pages were designed and developed to increase the member of a video streaming service, which communicate about the service and the benefit of becoming a member.
Sketch · InVision · Zeplin · Illustrator · Photoshop · HTML · CSS · JavaScript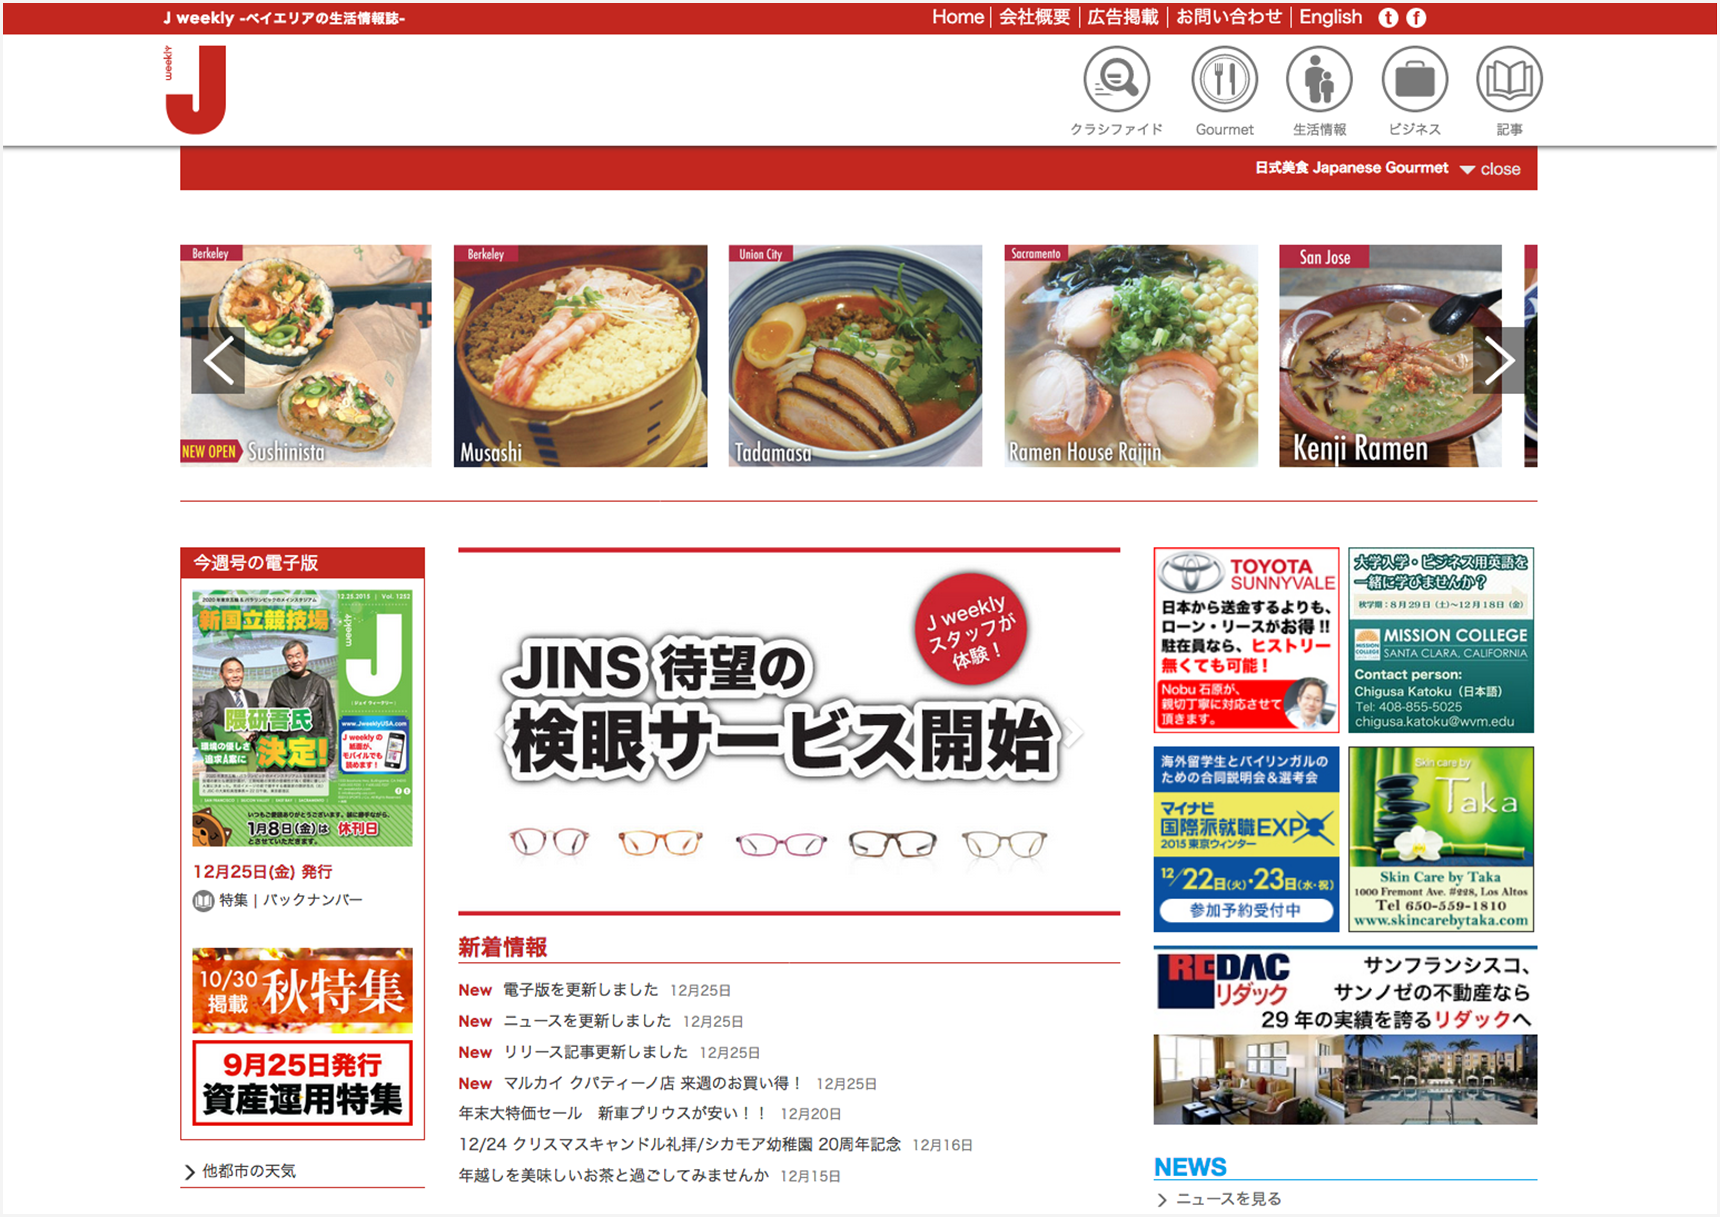
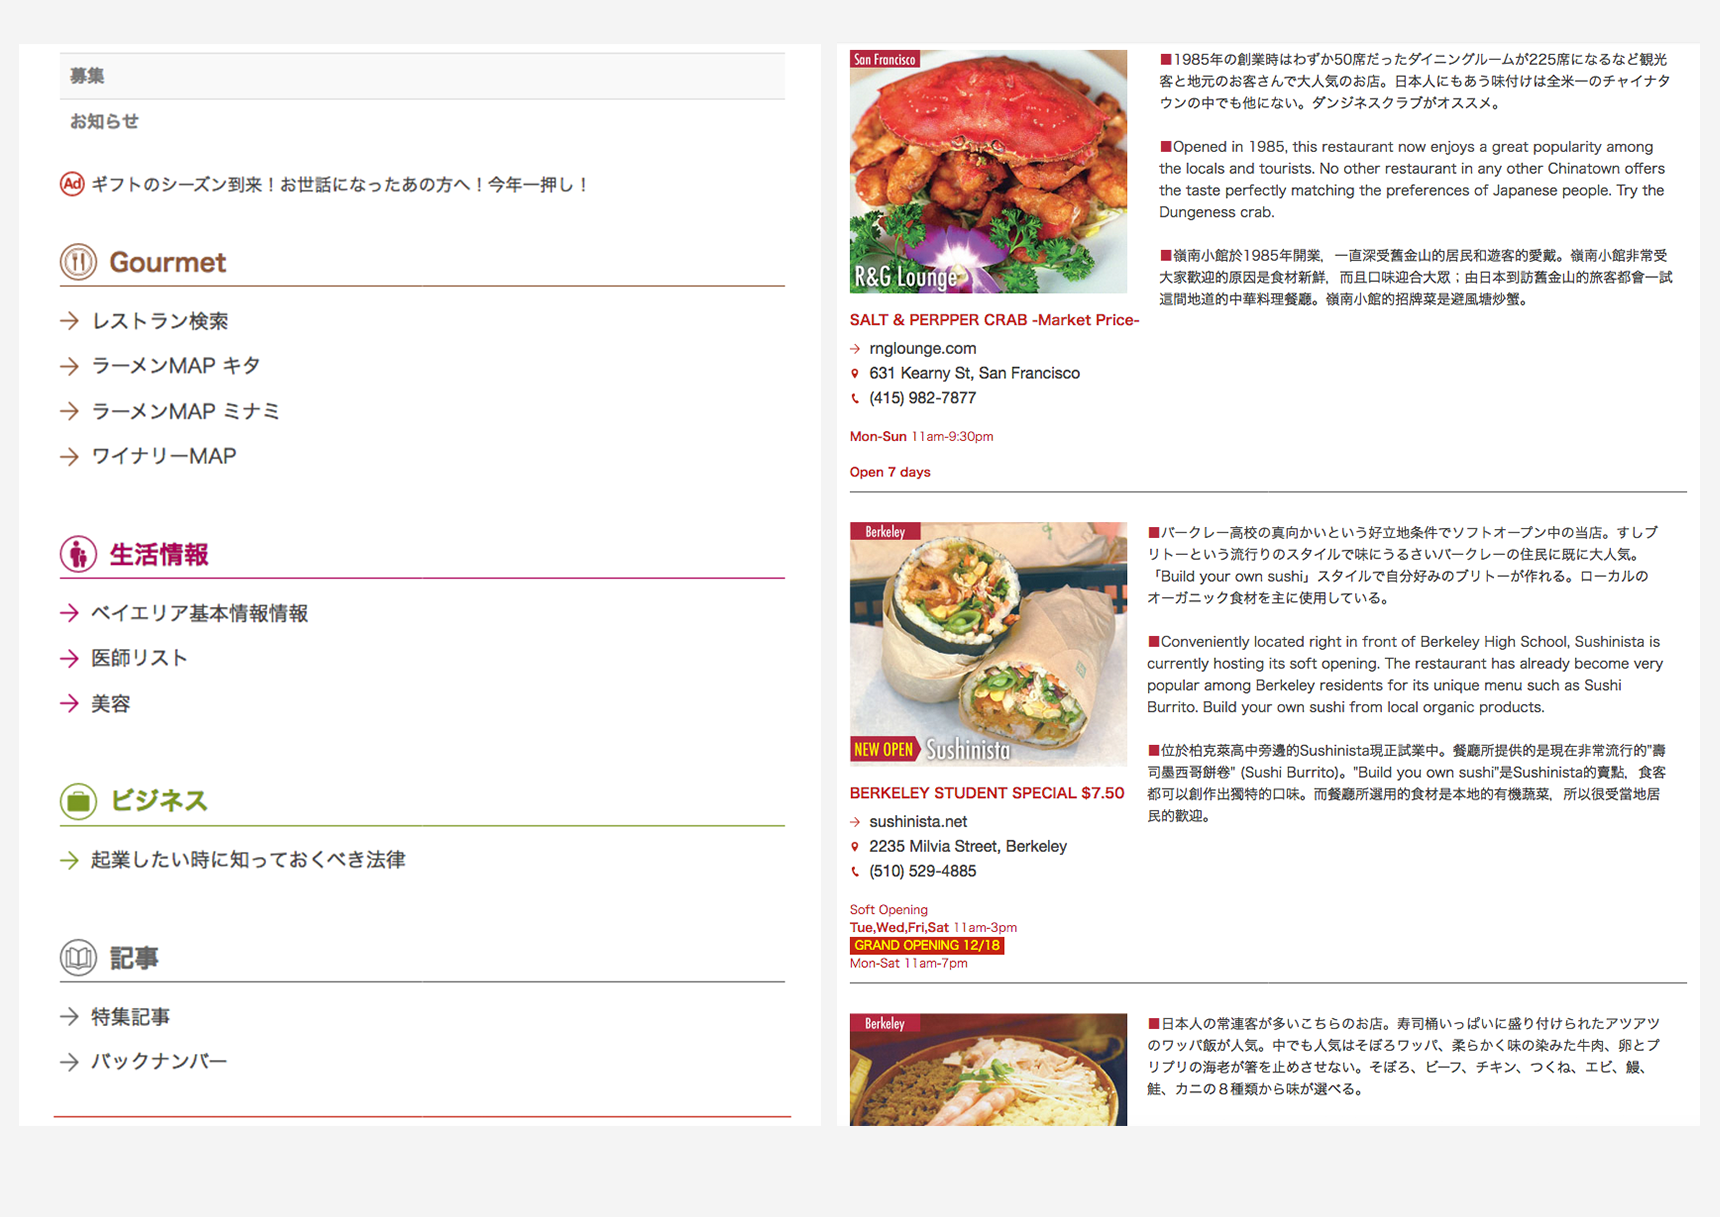
Website Renewal
This project is to renew an outdated Japanese media website. The new design was proposed by hearing the client’s requests (e.g. modern looking and accessibility of information on the website) and then developed.
HTML · CSS · JavaScript · Illustrator · Photoshop
Commemorative Project
This poster is a final project for a design (typography) course at San Francisco State University. Miriam Makeba was (randomely) selected as a person to commemorate and promote by using various media including this poster.
Illustrator · Photoshop
ID Redesign
This graphic is an assignment for a design (typography) course at San Francisco State University. Information on a passport was used as a source, and the information there was recomposed.
Illustrator · Photoshop
Logo Designs
Although it is not the main work, I like logo designs, which communicate messages with minimum visual elements.
Illustrator · Photoshop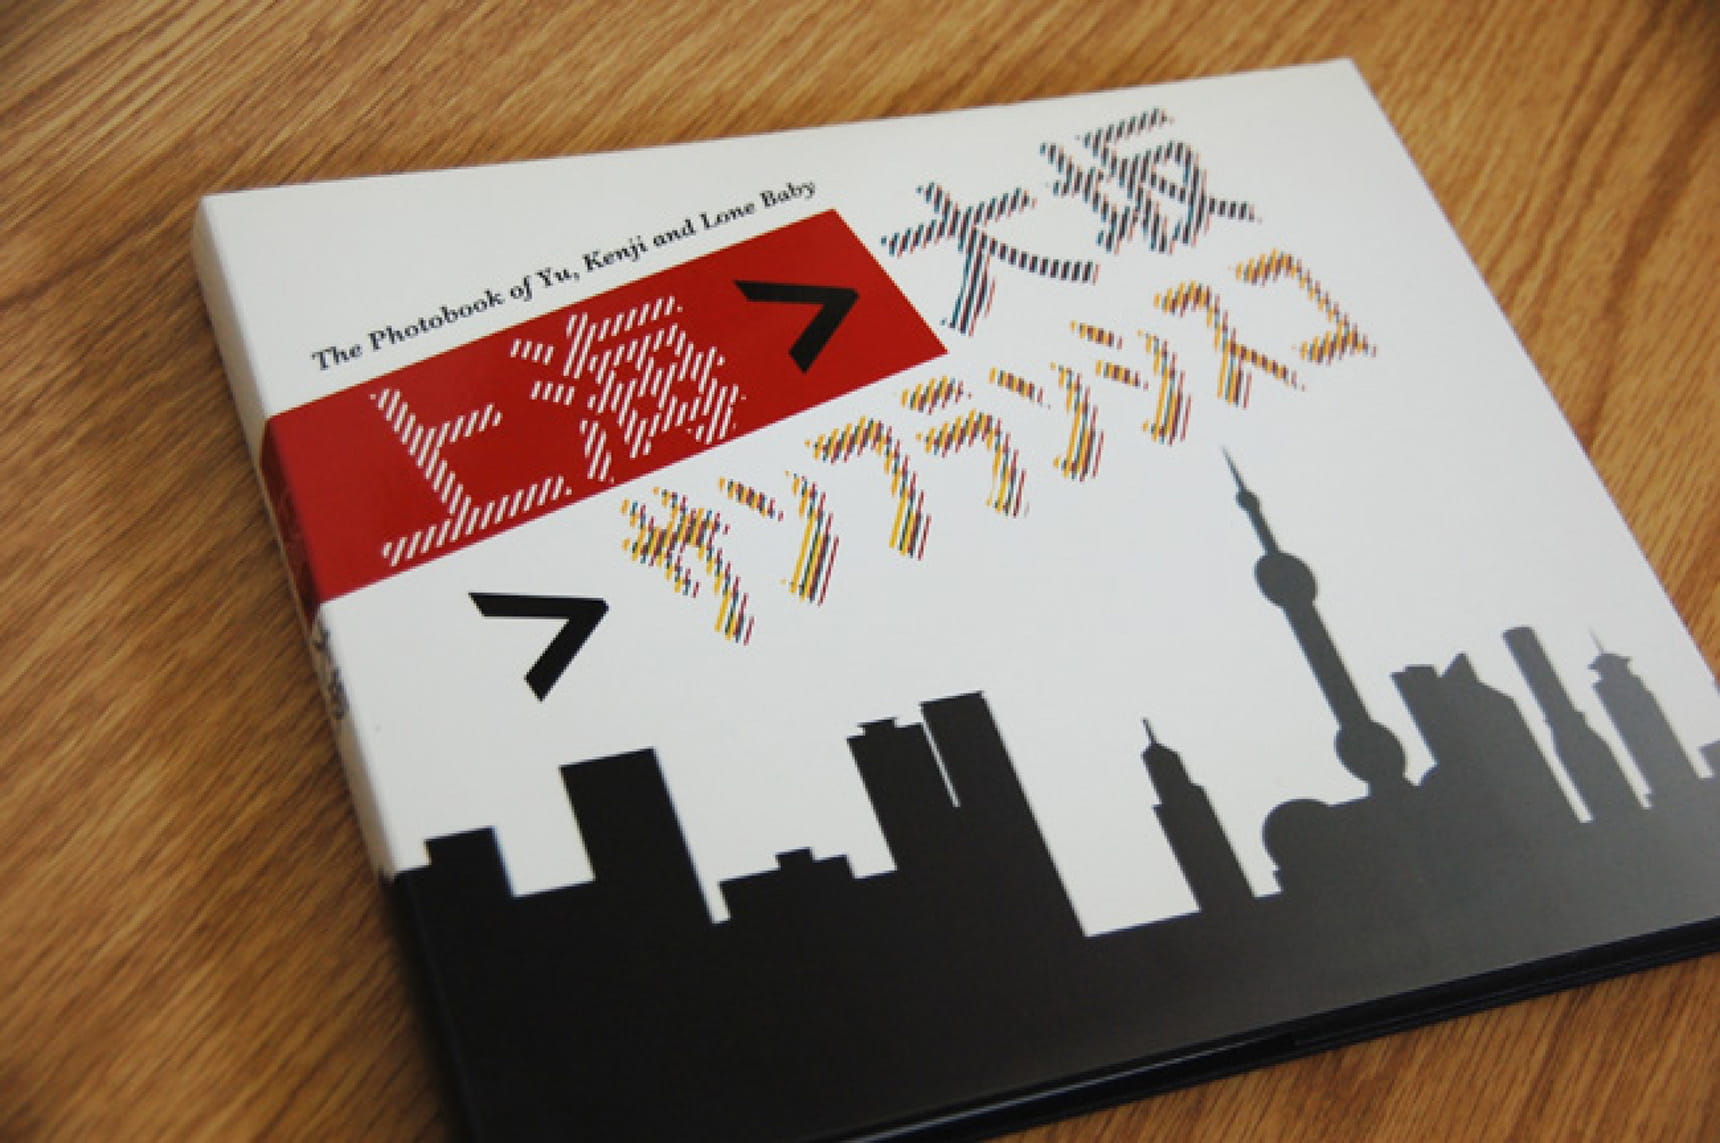
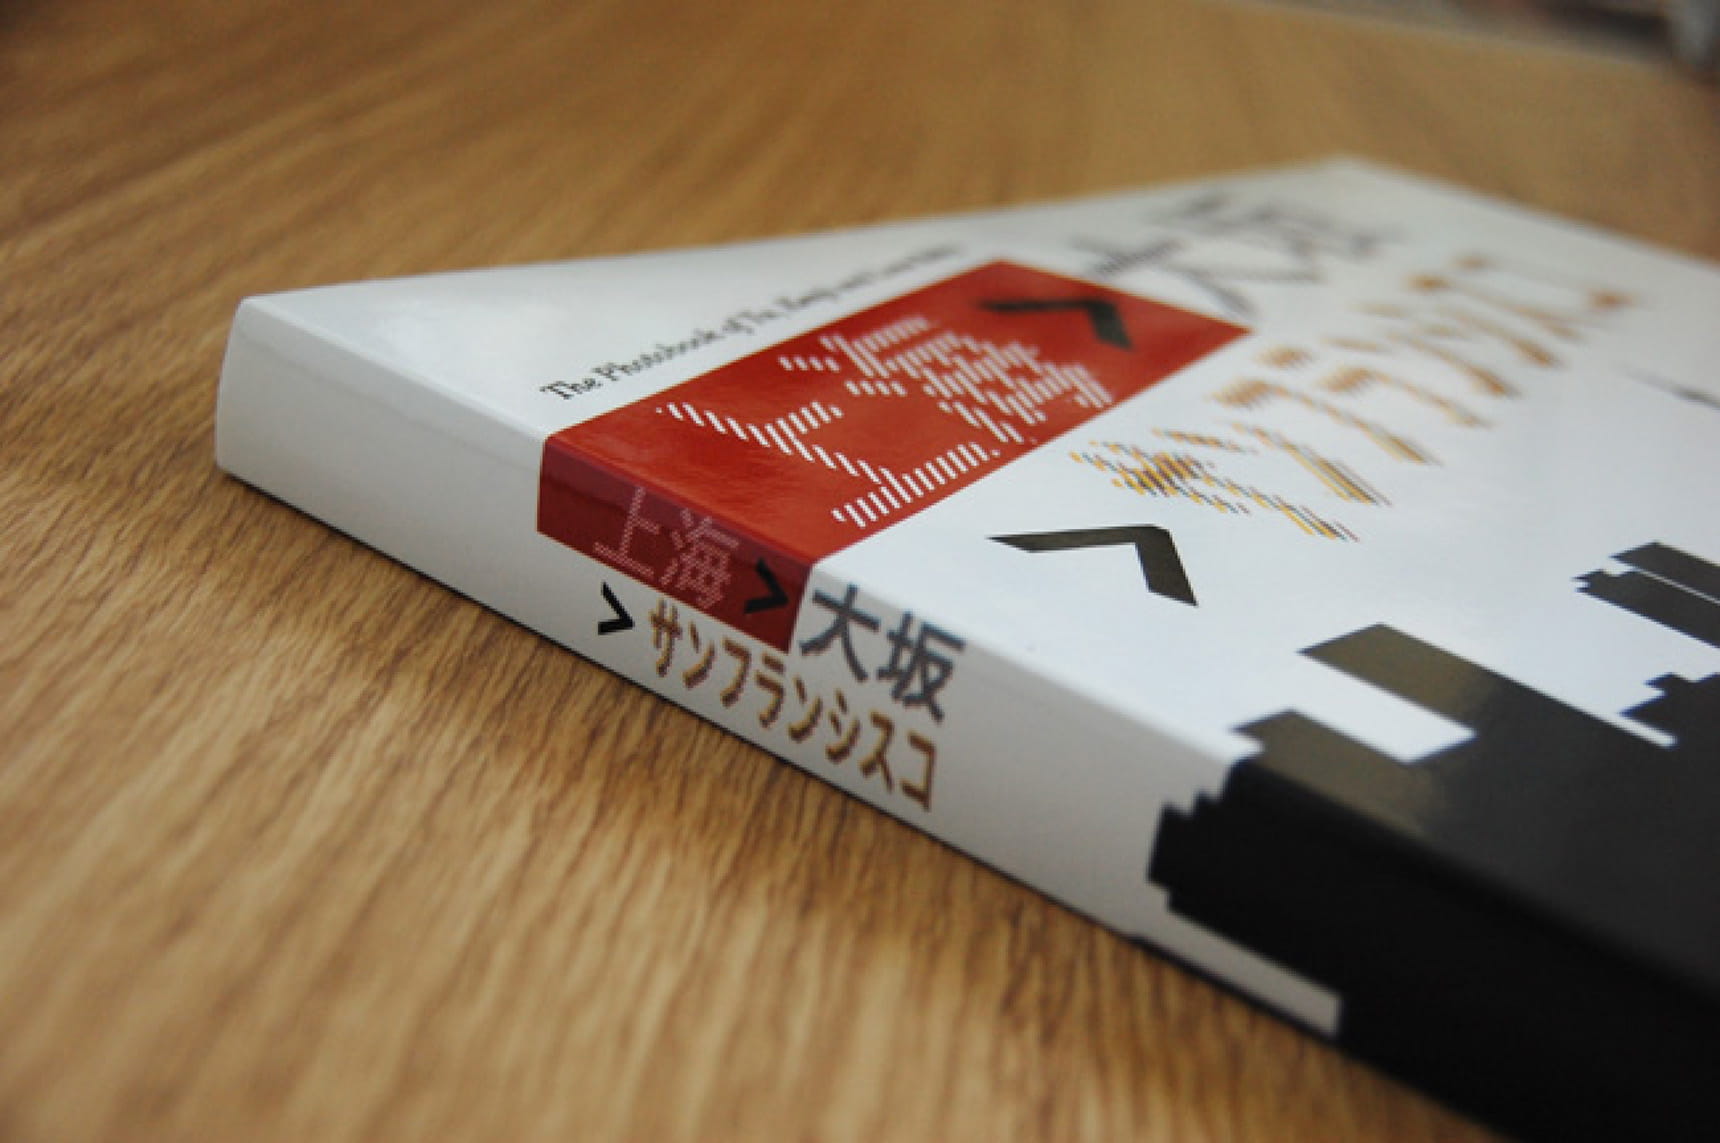
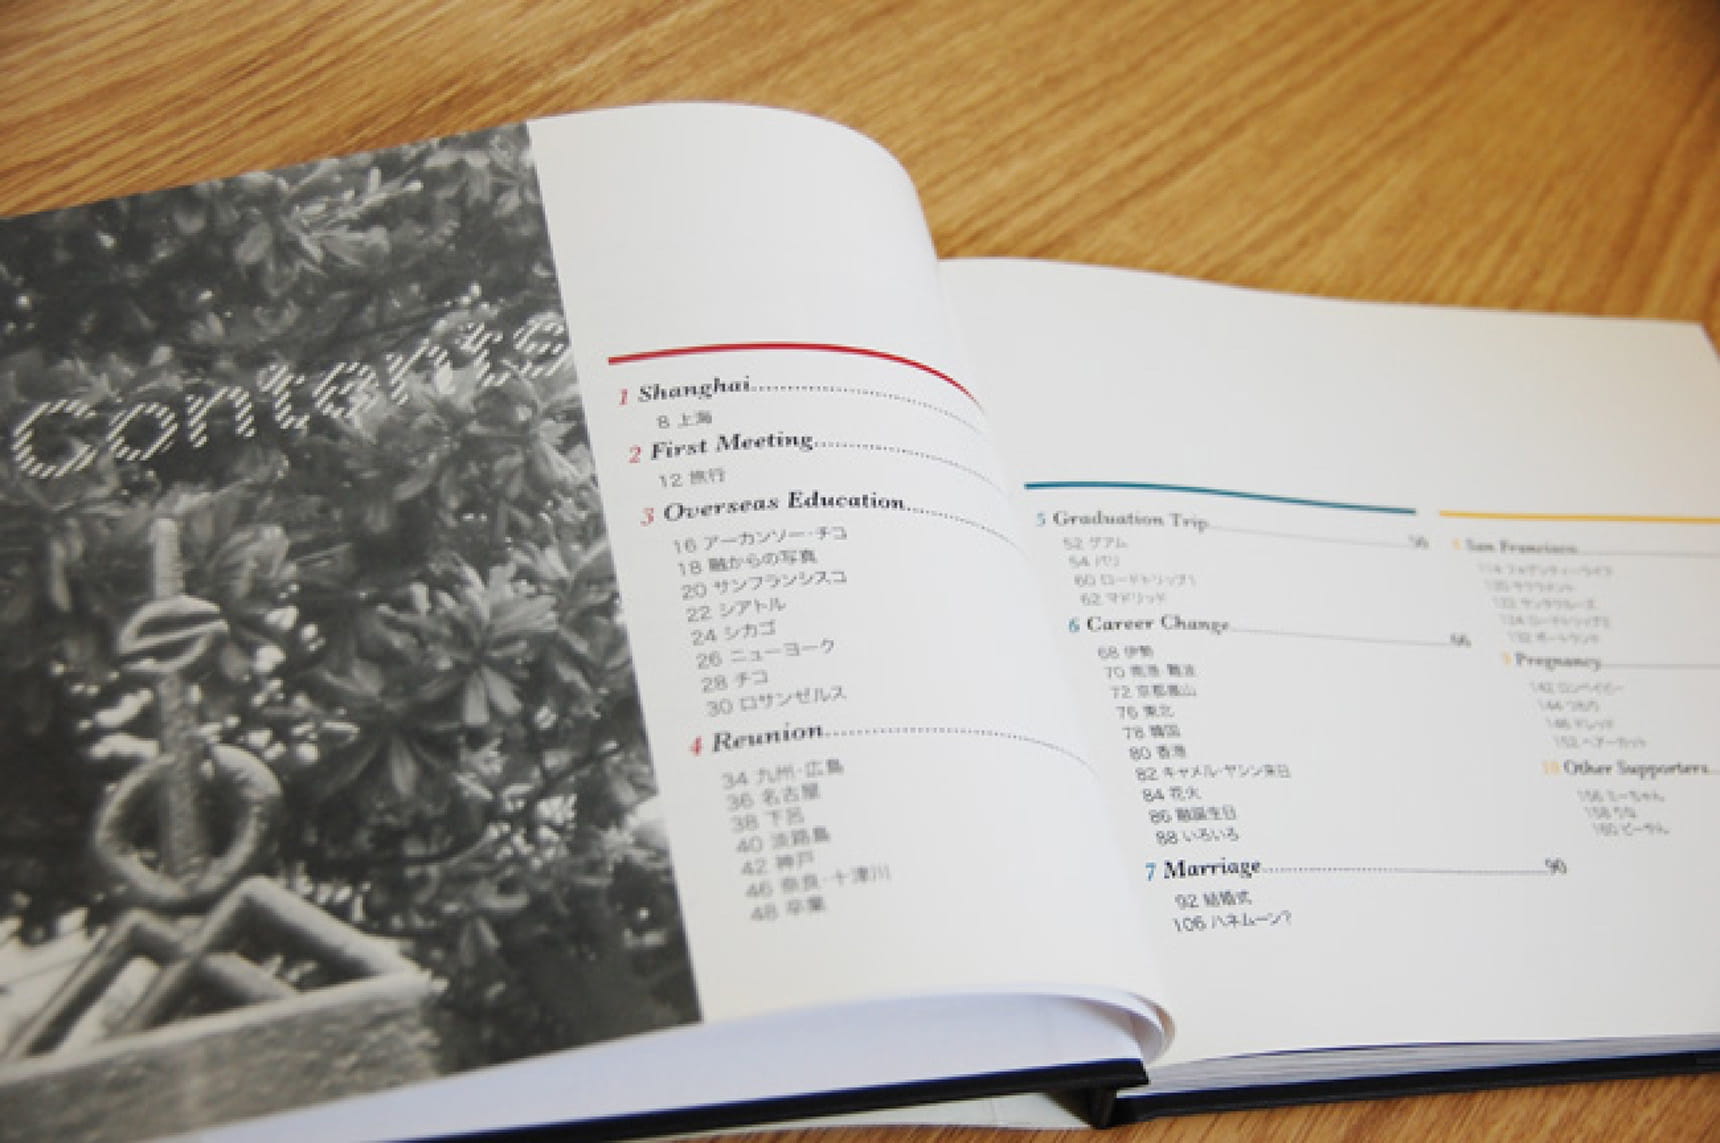

Photo Book
(Personal Project)
This book is a personal editorial design project using Adobe InDesign and Photoshop.
InDesign · Illustrator · Photoshop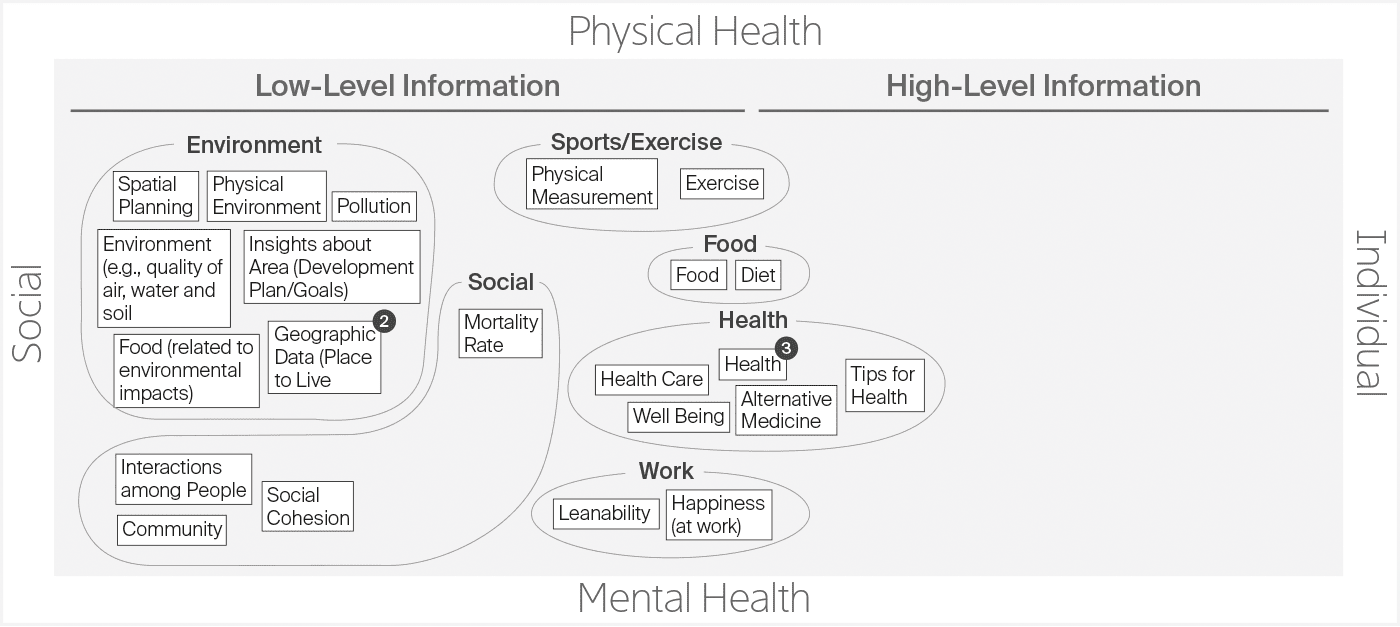

